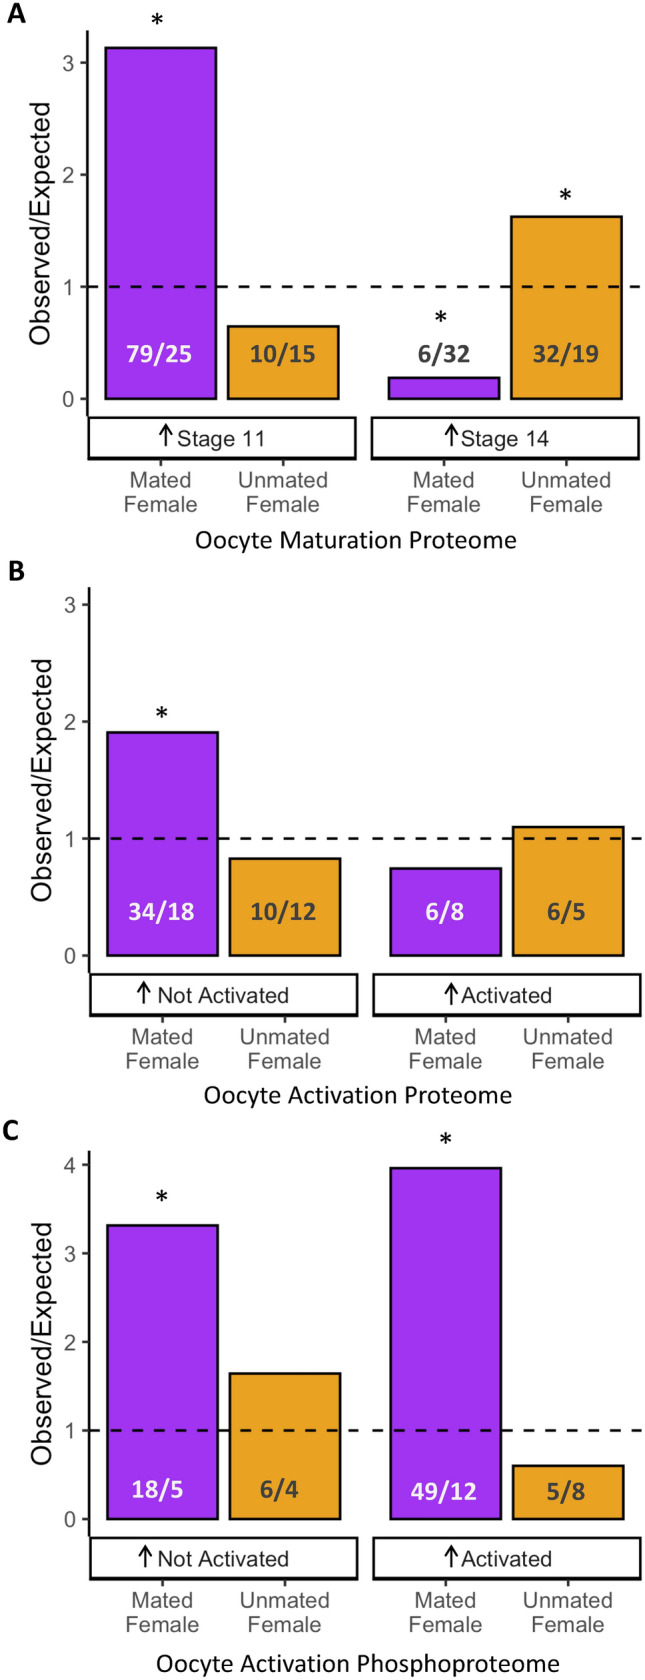
Figure 5.

Comparison to protein changes that occur during oocyte maturation and activation. Bar plots of the observed versus expected protein overlap between protein abundances differences in oocytes from mated (purple) and unmated females (orange) with (A) proteomic changes during oocyte maturation, (B) proteomic changes during oocyte activation and (C) proteomic changes in phosphoproteins during oocyte activation. The number of observed versus expected (rounded to the nearest whole number) proteins is indicated. Significance is indicated by asterisks (*p < 0.01).
