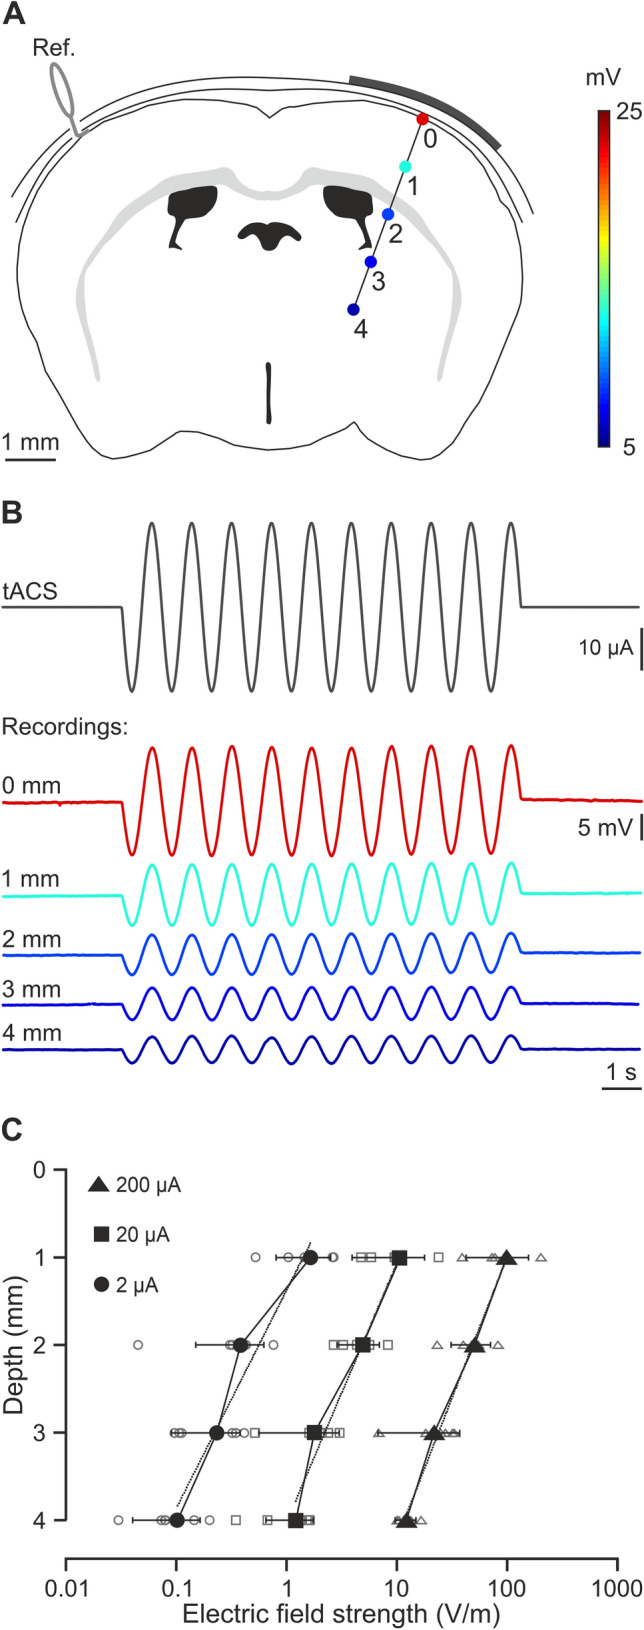
Figure 2.

Intracranial electric fields induced by S1-tDCS. (A) Schematic representation of electric potentials recorded in S1 at different depths. (B) tACS stimulation (top trace) applied over the scalp and grand average (n = 6 mice, unprocessed data) of the actual potentials generated at different depths (from 0 to 4 mm). (C) Average (filled symbols) and individual (empty symbols) electric fields recorded at different depths for ± 2 (circles), ± 20 (squares) and ± 200 μA (triangles) tACS.
