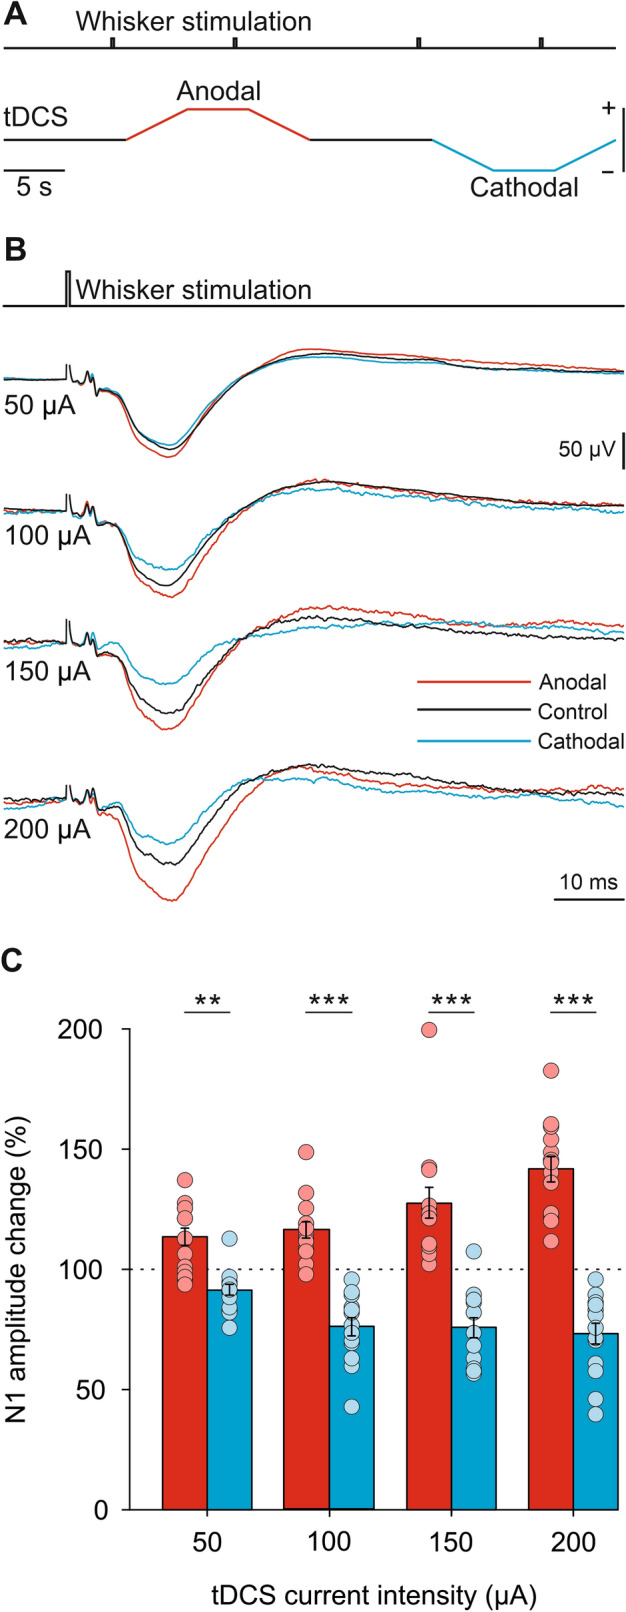
Figure 3.

tDCS immediate effects over SEPs in S1 cortex. (A) Schematic representation of tDCS protocol. (B) SEP average (n = 30) from a representative animal during control (black trace), anodal (red trace) and cathodal (blue trace) tDCS applied at 50, 100, 150 and 200 μA. (C) Quantification and statistical results of anodal tDCS (red histograms) and cathodal tDCS (blue histograms) effects on SEP amplitude. Mean (bars) and individual amplitude data (circles) are represented as percentage of change with respect to control values for all animals (n = 14 mice). Two-way repeated-measures ANOVA, CURRENT INTENSITY effect, F3,39 = 3.316, p = 0.030, POLARITY effect, F1,13 = 51.081, p < 0.001, CURRENT INTENSITY × POLARITY interaction, F3,39 = 27.818, p < 0.001, Holm-Sidak post hoc test. **p < 0.01; ***p < 0.001.
