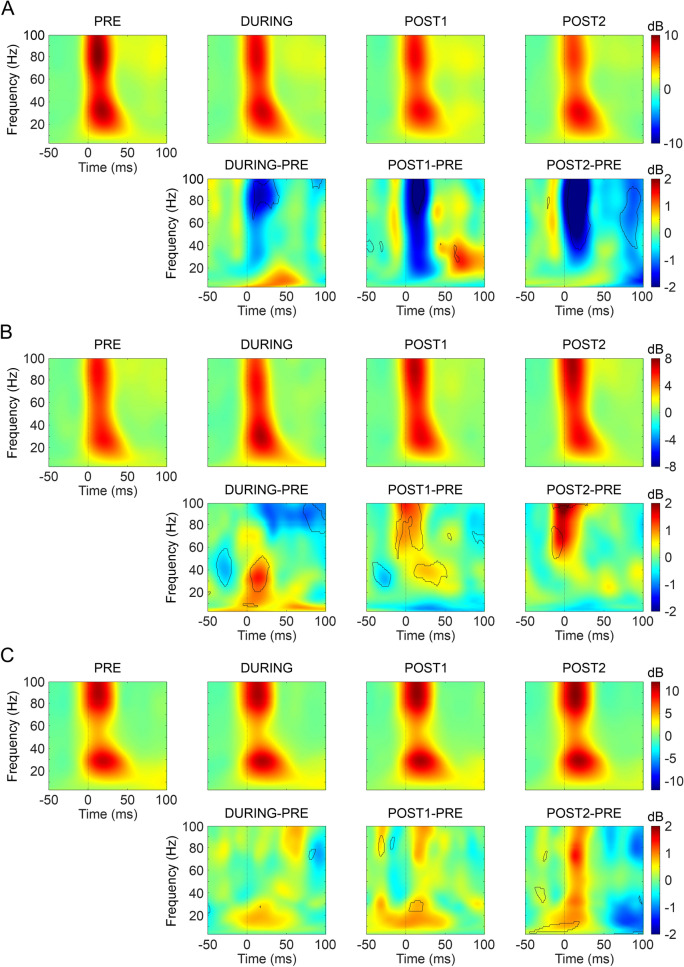
Figure 6.
ERSP analysis of the induced activity. (A–C) (Upper row) ERSP obtained for the 20 min before stimulation (PRE, first column), during tDCS (DURING, second column), the first 20 min after tDCS cessation (POST1, third column) and the next 20 min (POST2, fourth column) for cathodal (A), anodal (B) or sham (C) tDCS. (Lower row) Differences between the ERSP obtained in the 20 min before stimulation (PRE) and DURING (first column), POST1 (second column) or POST2 (third column) for cathodal (A), anodal (B) or sham (C) tDCS. Black outline represents statistical differences for that frequency and time range (p < 0.05, permutations).

