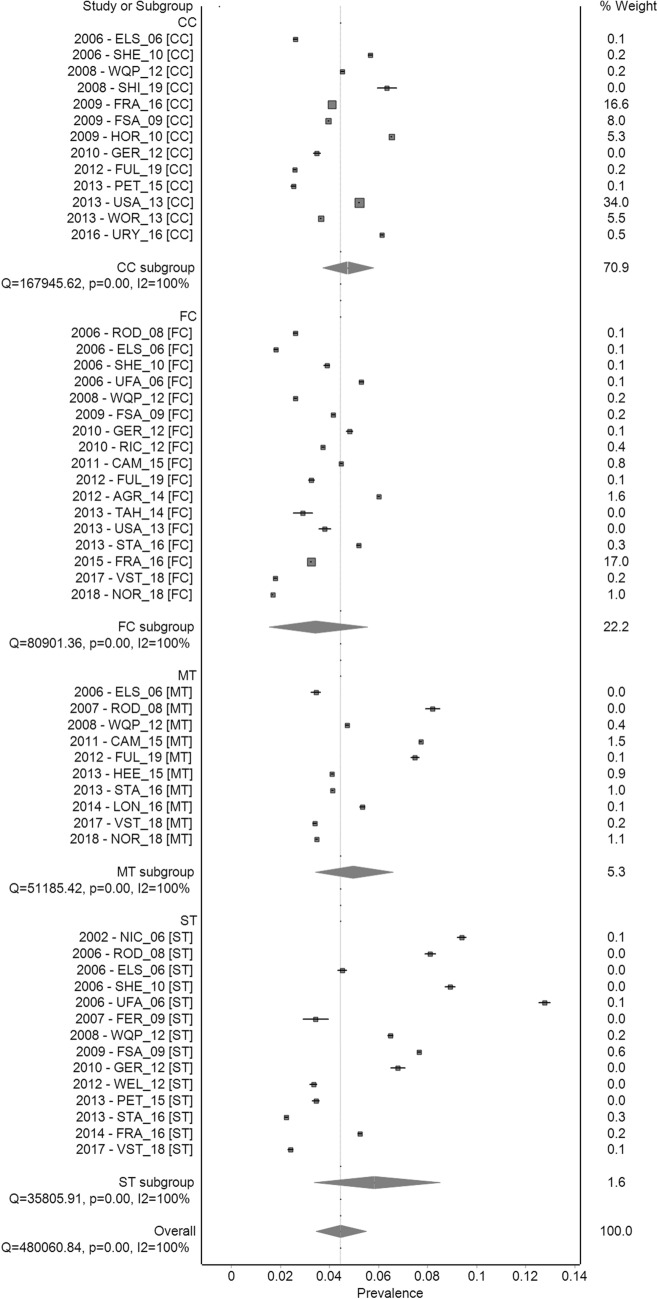
Figure 3.
Forest plot of mean cumulative mortality of commercial layer flocks (2000–2020). Cumulative mortality at 60 weeks in different commercially managed indoor systems: conventional cages (CC), furnished cages (FC), single-tier (ST) and multi-tier (MT) aviaries, ordered by the mid-year of data collection. Each square represents individual estimates from each data source. Square sizes represent the weight derived from the meta-analysis (see Methods). Pooled estimates (weighted averages) are represented by diamonds.

