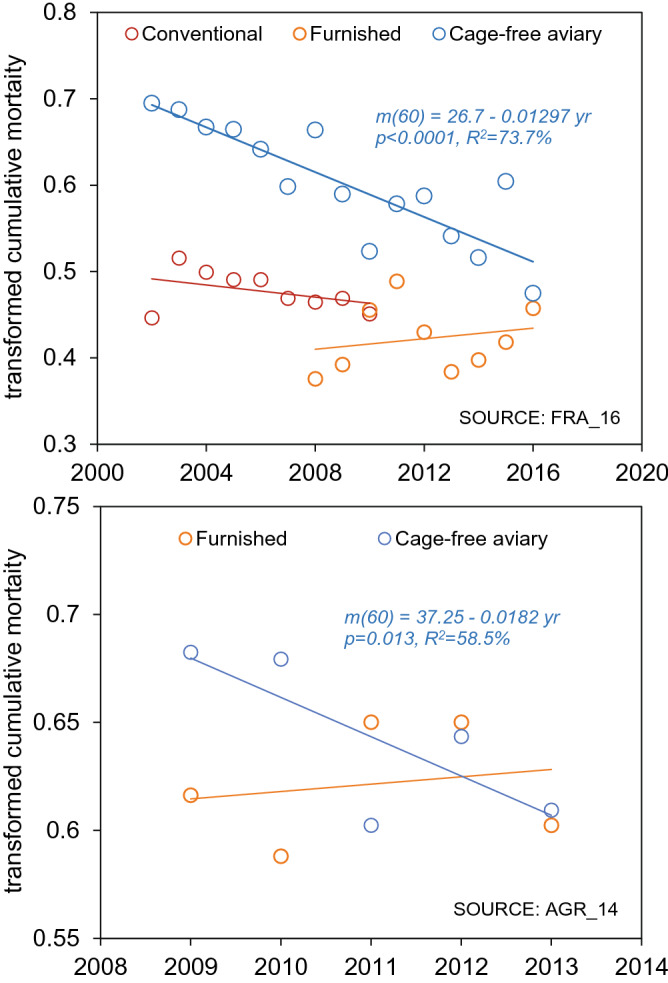
Figure 5.

Time series of cumulative layer mortality for two independent data sources. Regression of cumulative mortality rate (m60, double arcsine transformed) as a function of year of data collection for commercial flocks raised in conventional cages, furnished cages and a non-cage system (single-tier aviaries) in France (
source code FRA_16) and the Netherlands (AGR_14). Regression equations are shown where the effect of year is significant.
