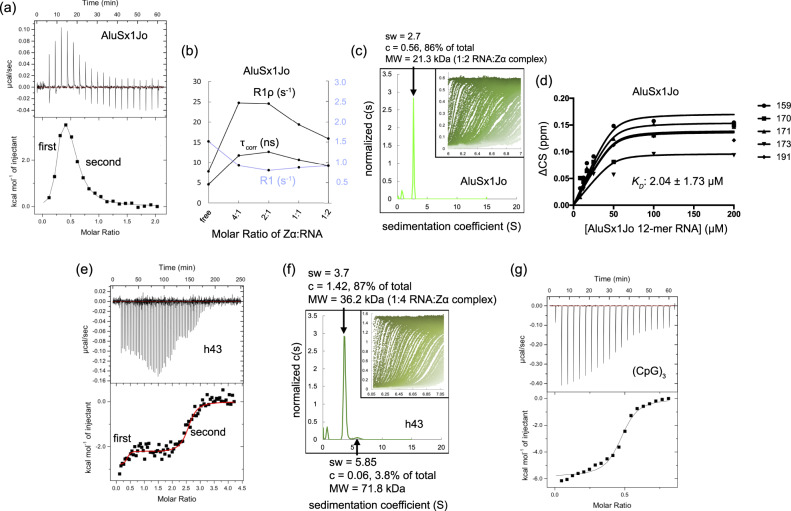
Fig. 5. Zα binds to AluSx1Jo and h43 in the nanomolar to low-micromolar range.
a ITC thermogram of AluSx1Jo titrated into Zα and fit to a two-site binding model. b Average (of the corresponding residue-specific values) longitudinal (R1), and rotating-frame 15N NMR relaxation rates (R1ρ), and the extracted effective overall correlation times (τcorr) are plotted versus the molar ratio of Zα:AluSx1Jo in the experiment (residue-specific R1, R1ρ, and τcorr are shown in Supplementary Fig. 9). Measured values are from one set of relaxation rate experiments. c Sedimentation coefficient distribution as obtained from analytical ultracentrifugation (AUC) with a 1:6 molar ratio of AluSz1Jo:Zα. The inset shows the raw data from the AUC run with the window position on the x-axis and absorbance on the y-axis, and individual scans over time going from left to right. d Global Kd fit of chemical shift perturbations (CSPs) of binding-site residues from the 15N-HSQC titration of AluSx1Jo into Zα, assuming a two-site binding model. Values are determined from one 15N-HSQC titration. e Isothermal calorimetry (ITC) indicating the multiple Zα domain binding events for E. coli h43. f Sedimentation coefficient distribution as obtained from analytical ultracentrifugation (AUC) with a 1:6 molar ratio of h43:Zα. g ITC thermogram and fit from titrating the (CpG)3 RNA into Zα. All ITC parameters are given in Table 1. ITC thermograms are representatives of two measurements and AUC data for AluSx1Jo and h43 are determined from one measurement each.

