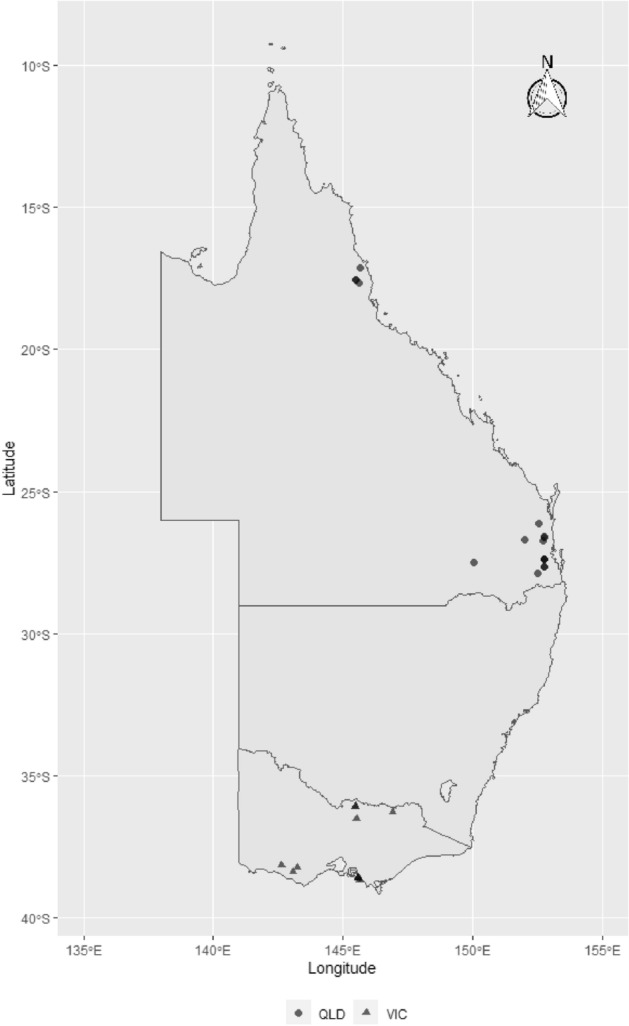
Figure 1.

Map showing the geographical distribution of S. uberis isolates sourced from farms in climatically distinct regions across Australia: Queensland (QLD) farms (North QLD (circles), South QLD (circles)), and Victorian farms (triangles). The symbols represent the townships centroids were the farms are located. The map was generated using ozmap package version 0.3.6 [https://CRAN.R-project.org/package=ozmaps]99 implemented within R version 4.0.2 [https://www.R-project.org/]100).
