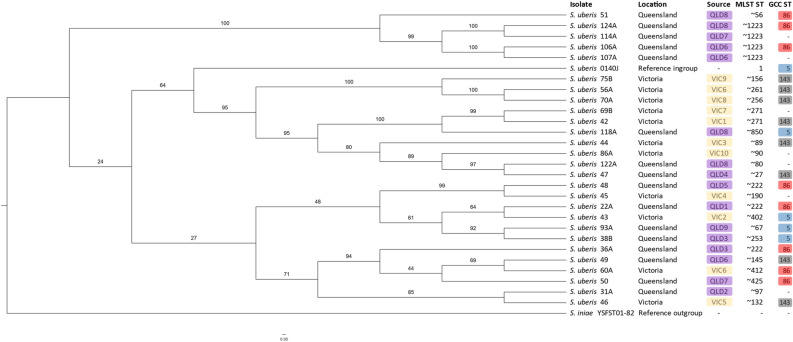
Figure 3.
Maximum likelihood phylogenetic tree based on core genome alignment between the S. uberis isolates identified in this study. S. iniae YSFST01-82 (accession number: GCF_000831485.1) was used as an outgroup and S. uberis 0140J (accession number: AM946015) (MLST ST1, GCC ST5) as an ingroup. Bootstrap values are shown in numbers along branches. Purple labels show Queensland isolates. Yellow labels show Victorian isolates. MLST STs are shown, as well as GCC STs. GCCs are coloured, GCC ST86 coloured red, GCC ST 5 coloured blue, GCC ST143 coloured grey. Core genome alignment was performed in roary (version 3.13.0)115 and maximum likelihood tree was built in RAxML version 8.2.10 (raxmlHPC-PTHREADS-SSE3)120 with 1000 replicates. Tree visualised in FigTree version 1.4.4 (http://tree.bio.ed.ac.uk/software/figtree/). For figure clarity, the phylogenetic tree was visualised using a cladogram transformation. Data S1 shows the untransformed tree, along with an isolate-only tree which shows very high bootstrap support at almost every node (~ 100%) due to the increased number of genes in the core genome alignment.

