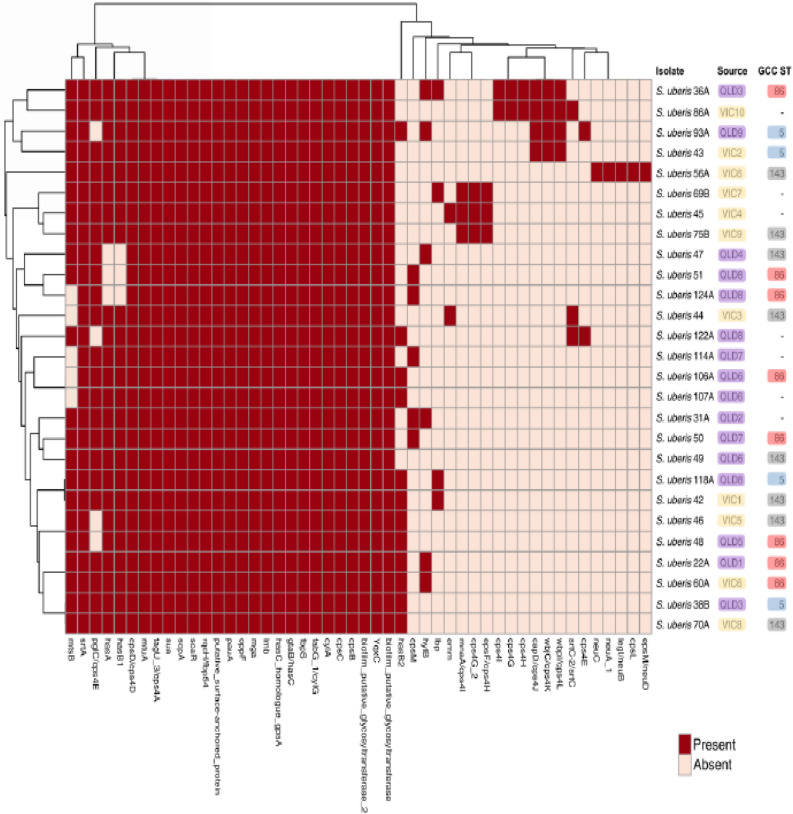
Figure 4.
Heatmap showing the presence/absence of virulence and putative virulence genes (x-axis) within the S. uberis isolates identified in this study (y-axis). Presence of virulence genes shown in red, absence in light pink. Core virulence genes are found in every isolate (27/27), while accessory virulence genes are found in < 27 isolates. Victorian isolates are coloured in yellow, Queensland in purple. GCCs are coloured, GCC ST86 coloured red, GCC ST5 coloured blue and GCC ST143 coloured grey. Data generated using ABRicate version 1.0.1 (https://github.com/tseemann/abricate)121 with the VFDB122 and the custom SuPVDB (Data S2). Heatmap produced using ClustVis (https://biit.cs.ut.ee/clustvis/)124 and Inkscape version 0.92 (https://www.inkscape.org).

