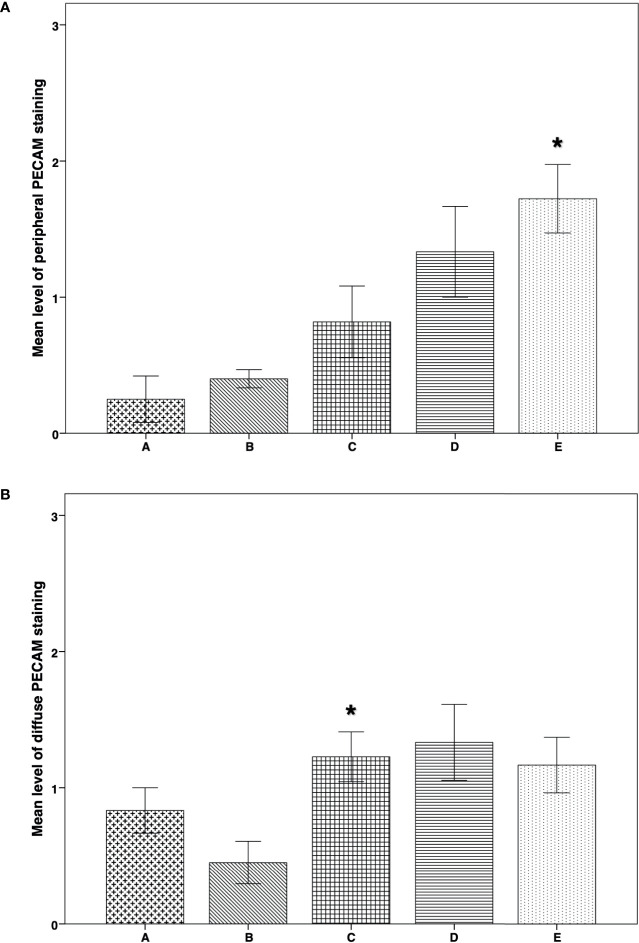
Figure 6.
IMH PECAM expression in thawed-ungrafted controls and implant groups. Results are represented as mean+SD. The x-axis represents the five experimental and control groups. The y-axis represents the level of PECAM staining. (A) Peripheral PECAM expression in thawed-ungrafted controls and implant groups. Levels were graded according to staining intensity similar to the TUNEL staining in Figure 5. *significantly higher than group A and group B (P = 0.005, P = 0.008 respectively). (B) Diffuse PECAM expression in thawed-ungrafted controls and implant groups. Levels were graded as in Figures 5 and 6A.*significantly higher than group B (P = 0.045).

