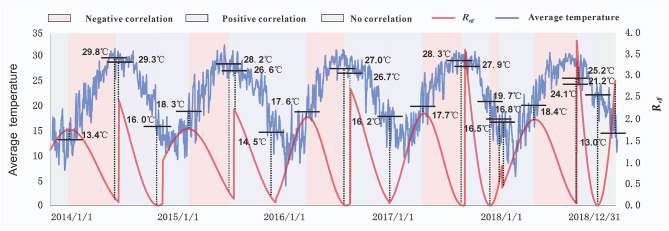
Figure 4.
The relationship between the effective reproduction number (Reff) and average temperatures. The temperature values marked in the figure represent the temperatures corresponding to each key node of the Reff. Different background colors indicate the correlation between the Reff and average temperature at different stages. Purple represents a positive correlation, pink represents a negative correlation, and gray represents no correlation.

