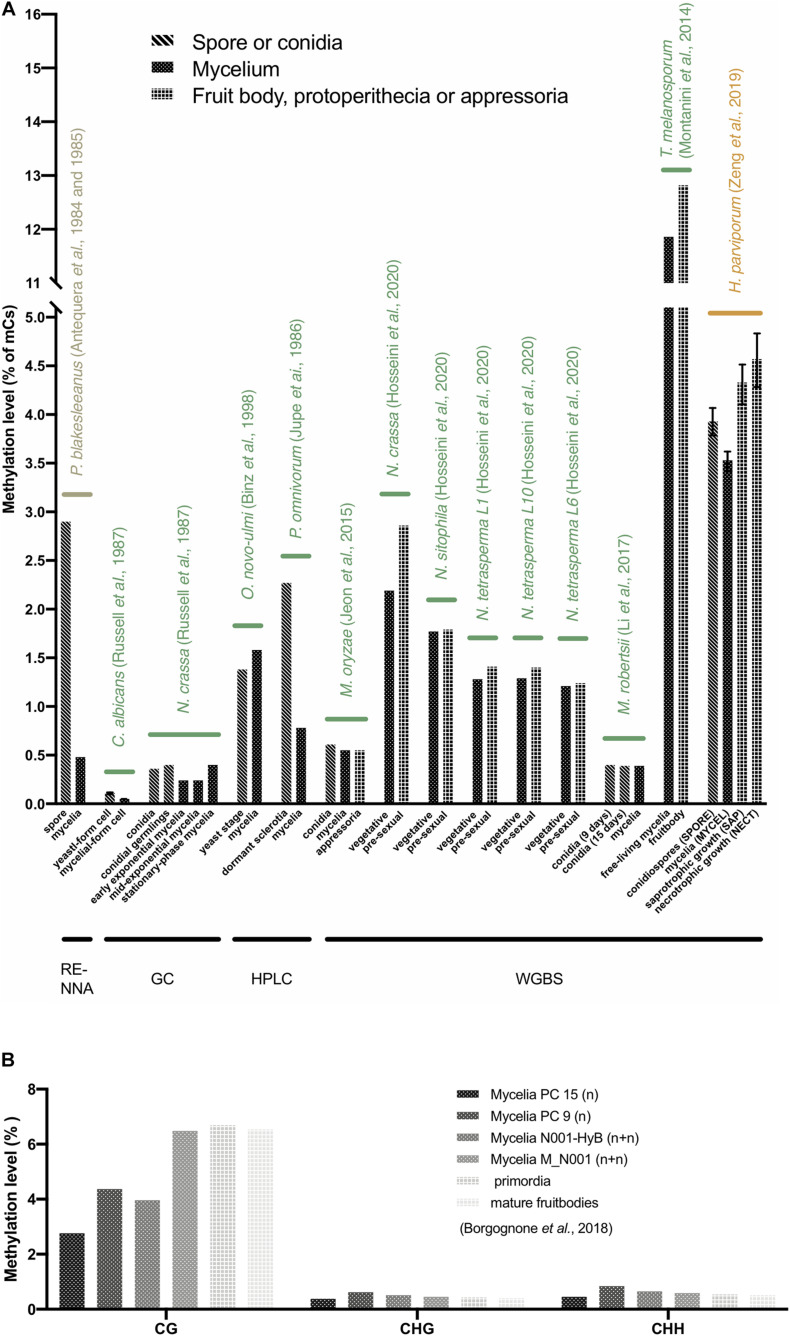
FIGURE 3.
DNA methylation levels at different life stages in fungi. (A) The average 5mC level of different life stages in 14 fungi. The X-axis represents the different life stages of fungi. The Y-axis represents the average 5mC level. The labels with different colors indicate fungi from Mucoromycota (olive), Ascomycota (green), and Basidiomycota (yellow). The methods of DNA methylation assays are shown below. (B) The CG, CHG, and CHH methylation levels of Pleurotus ostreatus (Borgognone et al., 2018). Note that only C. albicans and H. parviporum have replicates, therefore the error bars represent the variances.

