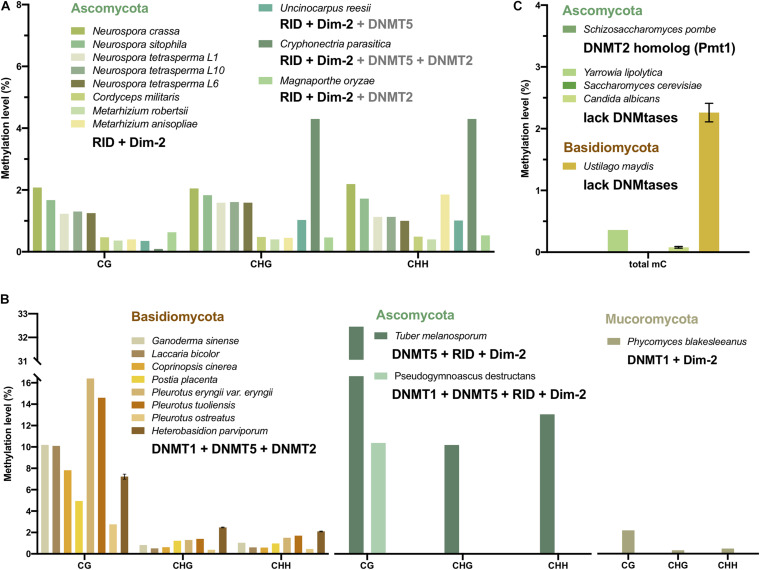
FIGURE 4.
CG, CHG, and CHH methylation levels and the DNMT combination of fungi. The methylation level values are from mycelium, not the other stages. The bars with different colors represent fungi from Mucoromycota (olive), Ascomycota (green), and Basidiomycota (yellow). (A) The DNA methylation level and the DNMT combination of fungi showed a preference for CHG and CHH methylation. (B) The DNA methylation level and the DNMT combination of fungi showed a preference for CG methylation. (C) The DNA methylation level of fungi without DNMT or with only tRNA methyltransferase. Note that only C. albicans, U. maydis, and H. parviporum have replicates, therefore the error bars represent the variances.

