Figure 3.
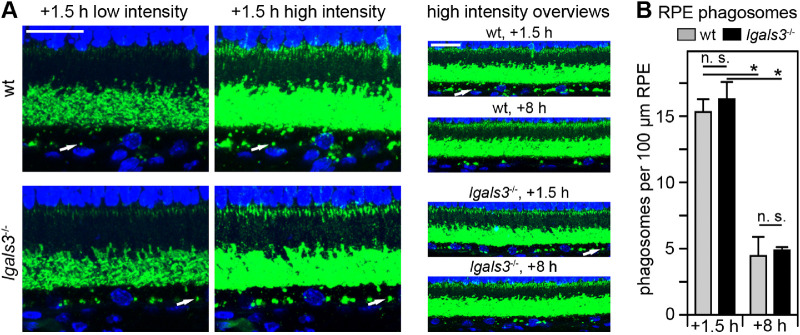
RPE phagosome loads are similar between wt and lgals3−/− mice. (A) Representative fields show maximum projections of 5-µm thick x-z stacks of wt and lgals3−/− retina sections collected at 1.5 and 8 hours after light onset as indicated and stained for rhodopsin (green) and nuclei (blue). Low intensity images (left column) are shown to compare rhodopsin labeling in intact outer segments, which was comparable between wt and lgals3−/− retina. High intensity imaging of the same fields (center column) is shown to detect rhodopsin-positive phagosomes in the RPE. These images are deliberately overexposed to visualize phagosomes. Overview images of longer stretches of the same sections and of equivalent sections from tissues harvested at 8 hours after light onset are shown in the right column. Arrows indicate one (and the same) individual phagosome in all three types of images in wt and lgals3−/− tissue, respectively. Scale bars = 20 µm. (B) Phagosome quantification was performed by counting rhodopsin-positive inclusions of 0.5 µm or larger in diameter in the RPE from experiments and long stretch, high intensity images as shown in the right column of A. Bars show number of phagosomes per length of wt and lgals3−/− RPE; mean ± s. d., n = 5; 2-way ANOVA with Tukey's post hoc test; *p < 0.05; n. s., not significant.

