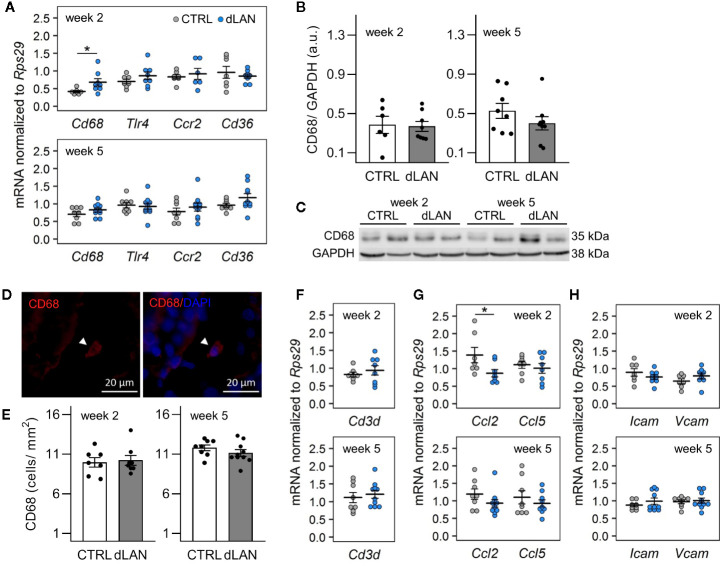
Figure 2.
Dim light at night (dLAN) alters renal expression of Cd68 and monocyte-attracting chemokine Ccl2. Rats were exposed to either the control light–dark (LD) regime (CTRL) or dLAN (~2 lx). After 2 and 5 weeks, rats were sacrificed between ZT3 and ZT6 and the kidneys were isolated for qPCR, Western blot and immunofluorescence analyses. (A, F–H) Relative mRNA levels of macrophage markers (A), T cell marker Cd3d (F), monocyte and lymphocyte chemokines (G) and cell adhesion molecules (H) for rats exposed to either the CTRL (grey dots, n = 7–8) or dLAN regime (blue dots, n = 7–10) for 2 or 5 weeks. Data are shown as dot plots with the mean (thick horizontal lines) ± SEM (error bars). (B) Representative immunoblot of CD68 normalized to GAPDH showing 2 rats per each group. (C) Quantification of CD68 from immunoblots. (D) Representative immunofluorescent images of macrophage marker CD68 (red) counterstained with DAPI (blue). Arrowheads indicate CD68-positive cells. (E) Quantification of CD68-positive cells from immunofluorescent images. Data represent the mean ± SEM with n = 6–10 per group. Black dots indicate the individual data points. CTRL and dLAN groups were compared with the Student’s t-test. *P < 0.05.

