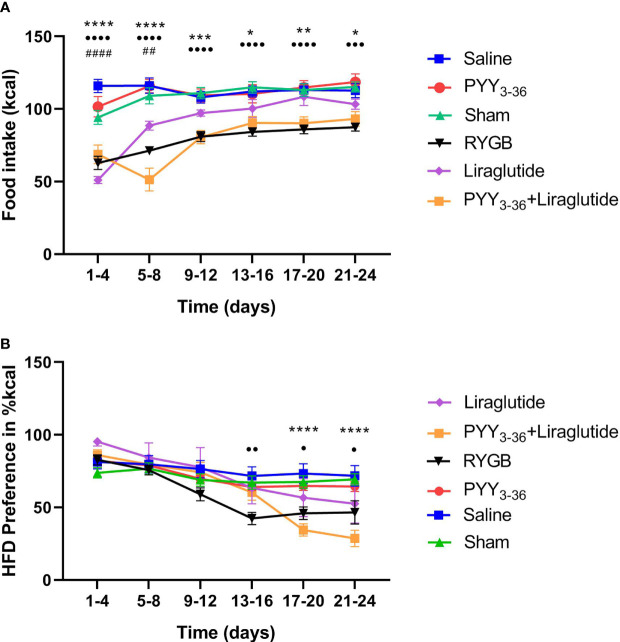
Figure 2.
RYGB and PYY3-36+liraglutide lower overall food intake. (A) Food intake in kcal and (B) preference for high-fat diet in percent (kcal) in 4-day intervals of RYGB (n = 14), sham (n = 13), PYY3-36+liraglutide (n = 11), liraglutide (n = 5), PYY3-36 (n = 5), and saline (n = 9) groups post intervention. (A) ••••p ≤ 0.0001 and •••p ≤ 0.001 for differences between RYGB and Sham; ****p ≤ 0.0001, ***p ≤ 0.001, **p ≤ 0.01, *p ≤ 0.05 for differences between PYY3-36+liraglutide and saline; ####p ≤ 0.0001, ##p ≤ 0.01 for differences between liraglutide and saline as determined by two-way ANOVA with Tukey’s post-hoc. (B) •p ≤ 0.05 and ••p ≤ 0.01 for differences between RYGB and Sham and ****p ≤ 0.0001 for difference between PYY3-36+liraglutide and saline as determined by two-way ANOVA with Tukey’s post-hoc. (A, B) Data are presented as mean ± standard error of the mean.

