Figure 5.
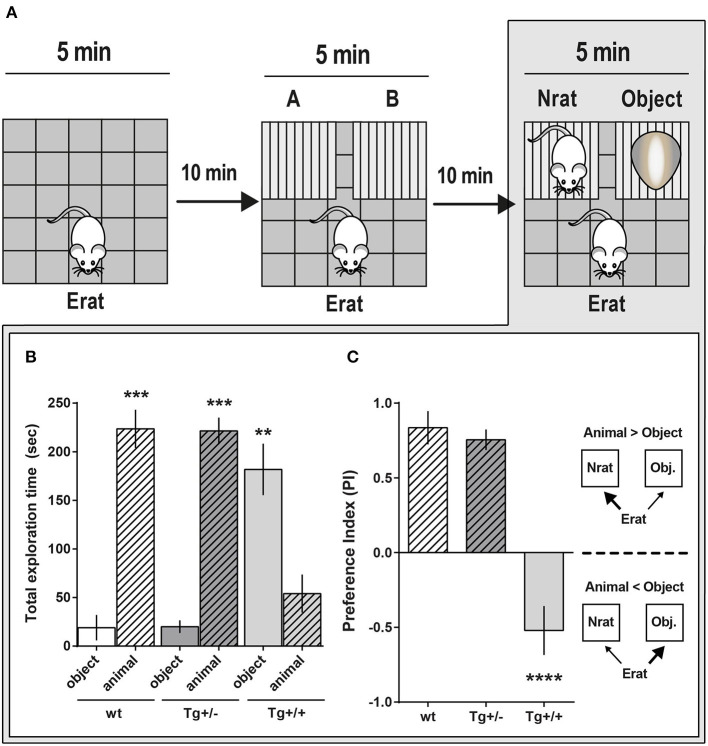
Social approach comparative behavior of McGill-R-Thy1-APP Homozygous Tg+/+ and Heterozygous Tg+/– rats. (A) Schematic representation of the task steps. 4-month-old Tg+/+, Tg+/– rats and their wt littermates were tested in an adapted version of the three-chambered task. Step 1: OF habituation. Step 2: Control for location/cages (lack of) preference. Erat explores the OF with A and B empty cages. Step 3: “Sociability” assessment. Erat explores the OF with a Nrat (novel rat, same sex, and age) in one cage, and an object (similar size and color than Nrat) in the other cage. (B) “Sociability”: Total exploration time of targets (Nrat or Object) during the 5 min session (Step 3 in A). Bar diagram represents the time (mean ± SEM) an Erat spent exploring an unknown Nrat, or an unknown object (O). Tg+/– animals (dark gray bars, NTg+/− = 13), Tg+/+ animals (light gray bars, NTg+/+ = 6), wt littermates (white bars, Nwt = 6). Object (O): stripped bars; Novel animal (Nrat): plain bars. Tg+/– and wt rats spent more time exploring a Nrat than the object; while Tg+/+ rats spent significantly more time exploring the object (***P < 0.001, **P < 0.01, Paired t-test). (C) Sociability Preference Index (PI = Nrat–O/Nrat+O) was calculated using the data shown in B. During the social task, wt (white bars) and Tg+/– (dark gray bars) Erats spent more time exploring the Nrat than the object (PIN−0 > 0; plain bars), while Tg+/+ Erats spent more time exploring the object than the Nrat (PIN−0 < 0; stripped bars). ****P < 0.0001, One-way ANOVA, Dunnett post- hoc test.

