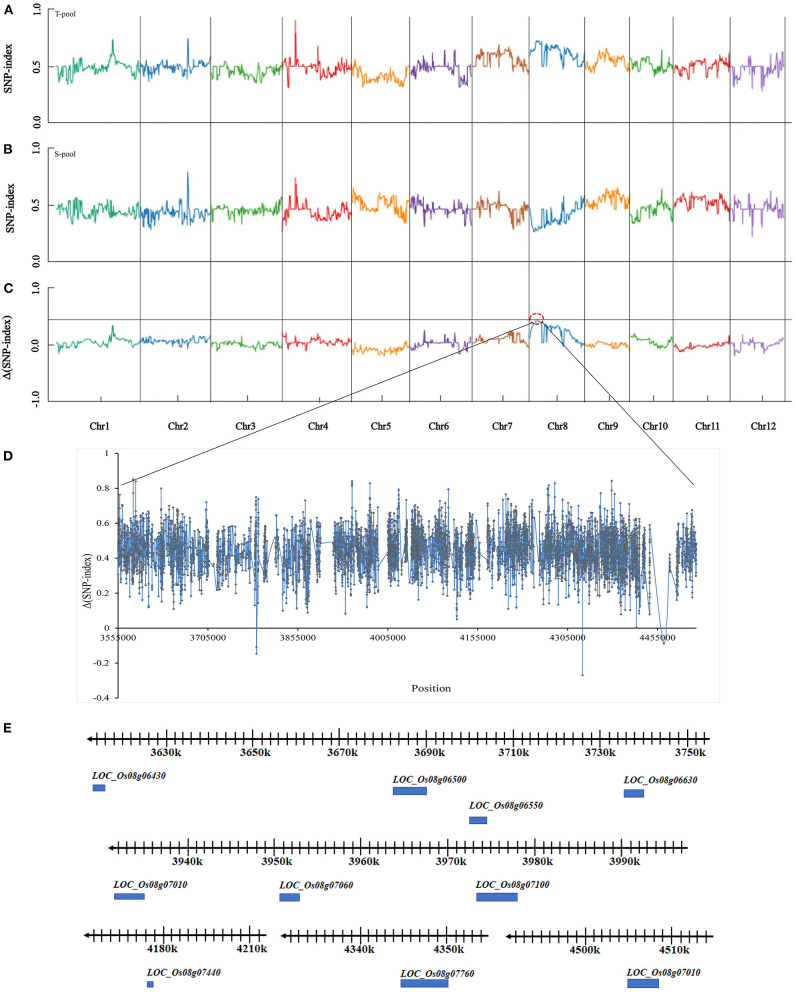
Figure 2.
SNP-index graphs of T-pool (A), S-pool (B), and Δ(SNP-index) graph (C) from BSA-seq analysis. X-axis represents the position of the 12 chromosomes in rice; Y-axis represents the SNP-index. The black line shows the association threshold at a 99.9% confidence level (C). HT major QTL is located to chromosome 8 (red dotted box). (D) Value of Δ(SNP-index) in the candidate region. (E) Physical location on chromosome 8 of the ten putative genes.

