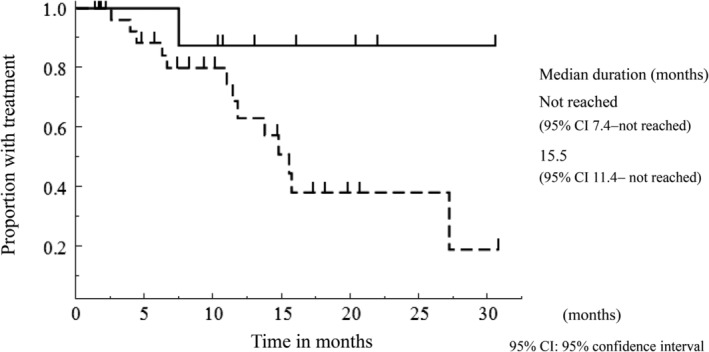
Figure 2.

The Kaplan‐Meier curve of treatment duration of osimertinib stratified according to the type of EGFR‐TKIs used for the treatment before osimertinib. ( ) Group A; (
 ) Group B

The Kaplan‐Meier curve of treatment duration of osimertinib stratified according to the type of EGFR‐TKIs used for the treatment before osimertinib. ( ) Group A; (
 ) Group B