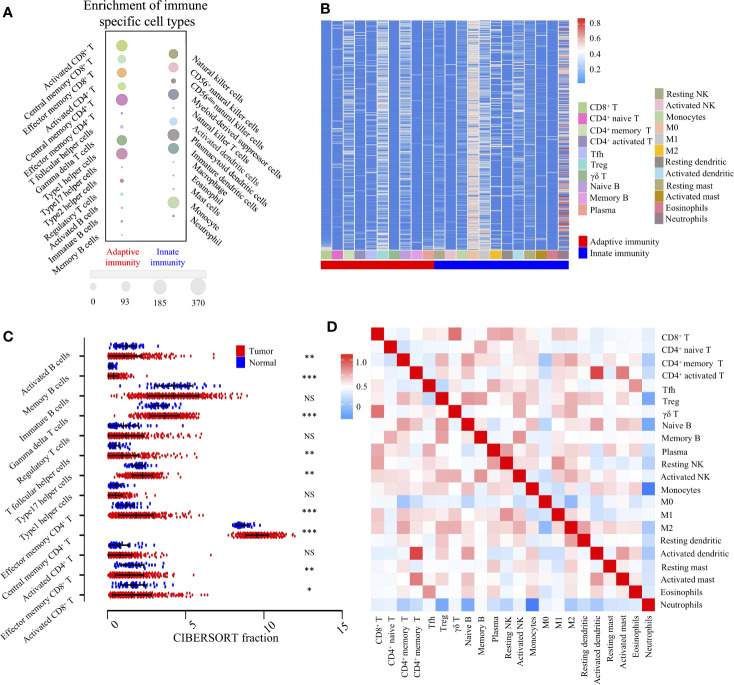
Figure 2.
Landscape of TME and gene modules of the 22 immune subtypes in TCGA-LIHC cohort (n = 370). (A). Bubble heatmap for comparison of two TME clusters, adaptive immunity, and innate immunity, comprising 28 immune cell fractions in TCGA-LIHC tumor tissues. The size of the circle represents the absolute value of the Z statistics. (B). Unsupervised clustering of 22 TME cell types in the TCGA-LIHC cohort. TME clusters are shown as patient annotations. Columns represent TME cells and rows represent samples. Hierarchical clustering was performed with Euclidean distance and Ward linkage. (C). Comparison of adaptive immune cells between tumor (red) and normal tissues (blue) in the TCGA-LIHC cohort, calculated using the CIBERSORT algorithm. *, **, *** denote P < 0.05, P < 0.01 and P < 0.001, respectively. NS denotes no significance (Mann-Whitney test). (D). Correlation matrix followed by unsupervised hierarchical clustering in 22 immune subsets. Pearson correlation coefficients (R) were calculated. Correlation coefficients were plotted with negative correlation (blue), positive correlation (red), and R = 0 (white).

