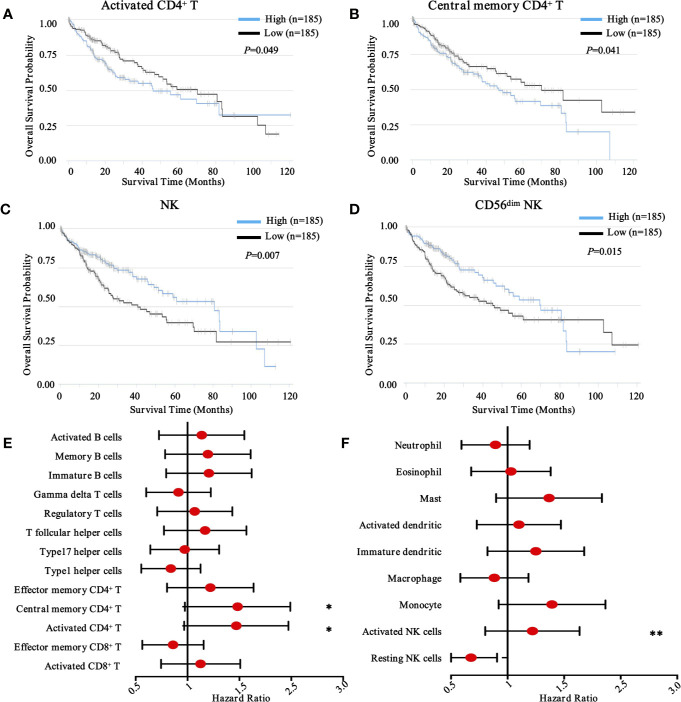
Figure 3.
Prognostic landscape of immunome profile in TCGA-LIHC cohort (n = 370). (A–D). Kaplan-Meier survival curve of tumor-infiltrating immune cells in LIHC (activated CD4+ T cell, central memory CD4+ T cell, NK cell, and CD56dim NK cell). (E, F). Forest plot showing the results of multivariate Cox regression analysis of 13 selected adaptive immunity cells and nine innate immunity cells in LIHC. *, ** denote P < 0.05 and P < 0.01, respectively.

