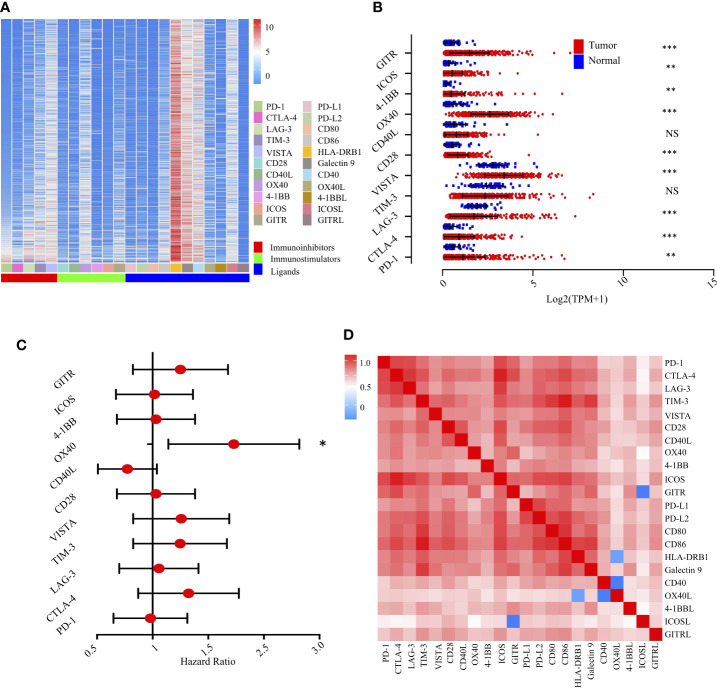
Figure 4.
Landscape of the immune checkpoints and corresponding ligands in TCGA-LIHC cohort (n = 370). (A). Unsupervised clustering of 22 immune checkpoints and specific ligands in tumor tissues. Columns represent receptors/ligands and rows represent samples. Hierarchical clustering was performed with Euclidean distance and Ward linkage. (B). Comparison of immune checkpoints between tumor and normal tissues in TCGA-LIHC cohort. *, **, *** denote P < 0.05, < 0.01, and < 0.001, respectively. NS denotes no significance (Mann-Whitney test). (C). Forest plot showing the results of multivariate Cox regression analysis of 11 selected immune checkpoints in LIHC. * denotes P < 0.05. (D). Correlation matrix followed by unsupervised hierarchical clustering in 22 immune checkpoints and specific ligands in tumor tissues. Pearson correlation coefficients (R) were calculated. Correlation coefficients were plotted with negative correlation (blue), positive correlation (red), and R = 0 (white).

