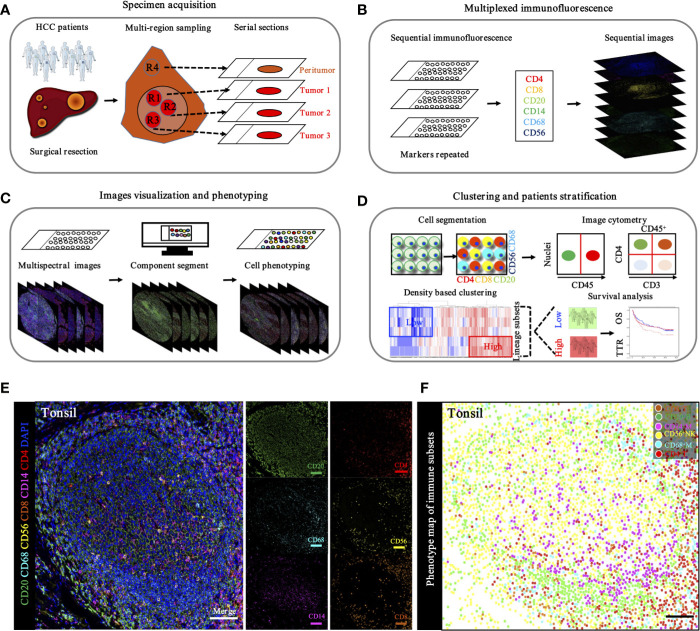
Figure 5.
Schematic workflow of TME landscape characterizing through seven-plex IHC of key immuno-oncology phenotypic bio-markers. (A). Specimen acquisition. Spatial multi-region sampling from FEEP sections. (B). Multiplexed IHC staining with specific targets indicated distinct phenotypes: CD4, CD8, CD20, CD14, CD68, and CD56, which denoted CD4+ T cells, CD8+ T cells, CD20+ B cells, CD68+ macrophages, and CD56+ NK cells, respectively. (C). Image visualization and phenotyping. Sequential steps, including single bio-markers, merged into composite image for enhanced target proteins visualization followed by inForm 2.1 (Perkin Elmer) based analysis including spectral unmixing, cell segmentation (nuclear/cytoplasmic/membrane) and cell phenotyping to precisely quantify immune evasion in tumor and adjacent peri-tumor. (D). Clustering and patients’ stratification. Clustering and patients’ stratification were performed through obtained single-cell-based chromogenic signal intensity and computer based K-means algorithm learning partitioning. (E). Immune landscape analysis of tonsil probed with a 7-plex panel labeling markers through multiplex IHC in tonsil. Scale bars, 100 μm. Representive images of individual channel in 7-plex panel, including CD4, CD8, CD20, CD14, CD68 and CD56, were presented. Scale bars, 100 μm. (F). Phenotype panel demonstrates that seven fluorescent signals can be clearly unmixed via spectral imaging. Scale bars, 100 μm.

