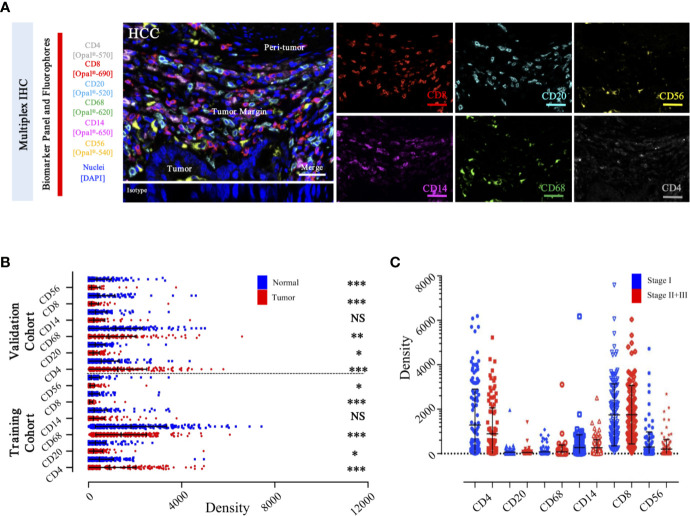
Figure 6.
Integrated and multiplexed IHC detection of immune landscape in ZS-HCC cohorts. (A). Seven-plex multispectral IHC images depict the immune landscape in HCC with tumor, peri-tumor, and margin invasion areas. (Iso) isotype-matched control antibody. Detailed single spectral image of seven-color panel, CD8 (red), CD68 (green), CD4 (white), CD56 (yellow), CD20 (cyan), CD14 (magenta), and DAPI (blue). Scale bars, 100 μm. (B). Comparison and distribution of the six-immune features between tumor and paired normal tissues in the training cohort (n = 258) and validation cohort (n = 178). *, **, *** denote P < 0.05, P < 0.01, and P < 0.001, respectively. NS denotes no significance (Mann-Whitney test). (C). Associations of the six-immune features in tumor areas with patients’ TNM stage in training cohort (n = 258).

