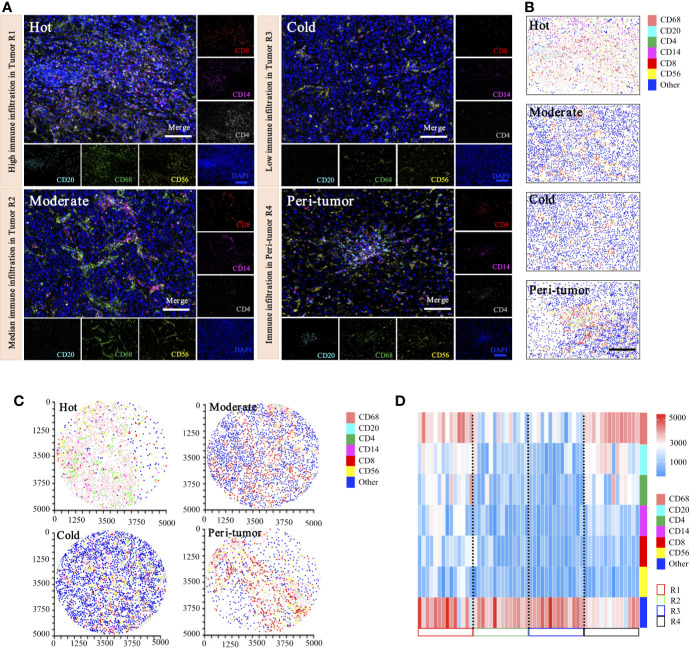
Figure 9.
Phenotyping of immune cell density-based subgrouping enables the evaluation of immune heterogeneity in HCC. (A). Representative images to show composite and panel of single spectral image for CD8 (red), CD68 (green), CD4 (white), CD56 (yellow), CD20 (cyan), CD14 (magenta), and DAPI (blue), with three distinct immune infiltration status in intra-tumor centers (R1, Hot; R2, moderate; R3, cold), compared with matched peri-tumor area (R4). Scale bars, 100 μm. (B). Representative phenotype maps indicated three distinct immune infiltration status (Hot, Moderate, and Cold) in intra-tumor tissues and corresponding peri-tumor area, with machine learning algorithm to virtually define in situ contexts. Scale bars, 100 μm. (C). Image cytometry-based quantification show multiplex IHC phenotyping findings, indicating high TILs infiltration in R1 (Hot), moderate TILs infiltration in R2 (Moderate), low TILs infiltration in R3 (Cold) and corresponding peri-tumor area (R4). Image plots depict location of cells were identified by image cytometry. CD8+ T cell (red), CD68+ macrophage (pink), CD4+ T cell (green), CD56+ NK cell (yellow), CD20+ B cell (cyan), CD14+ monocyte (magenta), and other cells (blue). (D). Heatmap presents densities of six distinct immune features in 14 HCC patients.

