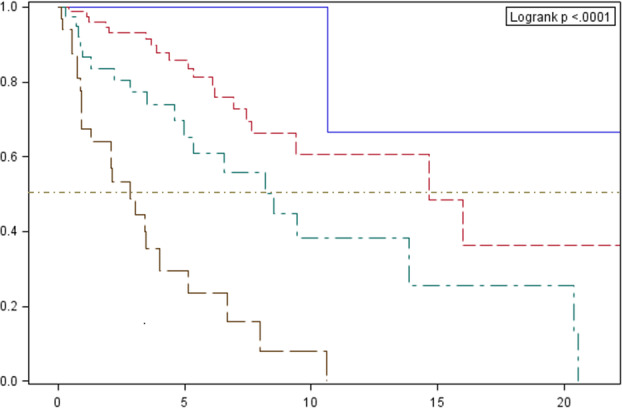
Figure 3.

Cumulative overall survival probability according to Masaoka classification estimated by the Kaplan‐Meier method, with a 95% confidence interval (dashed line designates the median). Survival probability (%). Follow‐up (years). Clinical stage: I# II# III# IV. *P‐value for comparisons between curves: 0.2032 (1 vs. 2); 0.3230 (1 vs. 3); <0.0001 (1 vs. 4); 0.0323 (2 vs. 3); <0.0001 (2 vs. 4); 0.0132 (3 vs. 4).
