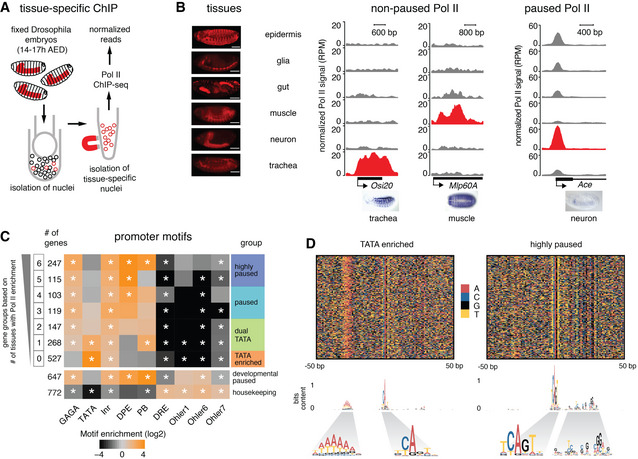
Figure 2. Tissue‐specific Pol II ChIP‐seq shows differences in Pol II occupancy patterns at effector genes.

- Tissue‐specific ChIP‐seq was done by isolating nuclei from specific tissues (shown in red) by expressing the Escherichia coli biotin ligase (BirA) and the biotin ligase recognition peptide (BLRP) fused with a nuclear envelope‐targeting sequence in the tissue of interest. This allows the isolation of nuclei from the tissue of interest using streptavidin magnetic beads.
- Pol II ChIP‐seq was performed in six different tissues shown in the left panel (scale bar ‐ 100 µm). The middle and the right panels show the read‐count normalized Pol II ChIP‐seq tracks (RPM) from the six tissues at individual genes. For each gene, gray and red tracks indicate non‐expressing tissues and expressing tissue, respectively. The middle panel shows the Pol II profile at two non‐paused genes, which have Pol II only in the expressing tissues. The expression is limited to specific tissues as shown in the in situ images from BDGP. The right panel shows the Pol II profile at a paused gene, which has Pol II in all observed tissues, although the expression is limited to specific tissues as shown in the in situ images from BDGP. Paused Pol II is generally highest in the tissue with the highest expression. We also found systematic differences between samples; thus, some tissues have generally higher enrichments than others, presumably because they are easier to cross‐link.
- Identified effector genes were grouped into seven groups based on Pol II penetrance, i.e. the number of tissues in which Pol II enrichment is above background (calculated in a window starting from the TSS and ending 200 bp downstream). Genes that are highly paused throughout embryogenesis (developmental paused) (Gaertner et al, 2012) and housekeeping genes are shown as a control. Core promoter elements are differentially enriched across the groups (Fisher's exact test with multiple‐testing correction, *P < 0.05), allowing us to classify promoter classes based on Pol II penetrance (highly paused, paused, dual TATA, TATA enriched). The highly paused group is defined by Pol II enrichments in 5–6 tissues and is similar to the developmental paused genes. TATA enrichment is found in the groups with Pol II enrichment in 0 or 1 tissues.
- Sequence heat map plots show clear and consistent motif differences between the TATA‐enriched and highly paused gene groups. The information content of the motifs is plotted as a sequence logo below, revealing a degenerative TATA box, an Inr with or without G, and downstream pausing elements all of which are consistent with previous results (Shao et al, 2019).
