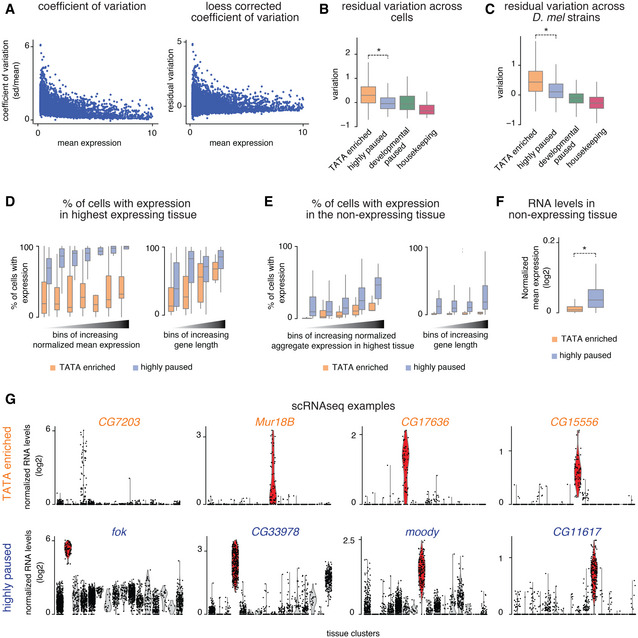
Since the coefficient of variation of gene expression (standard deviation/mean) shows a dependency on mean expression (left), it was corrected by loess regression (right).
The coefficient of variation after correcting for mean expression is lower for the paused genes compared with the TATA genes (Wilcoxon two‐sided test, *P < 10−15).
The loess‐corrected coefficient of variation of gene expression across different isogenic lines of
Drosophila melanogaster from the DGRP collection (Sigalova
et al,
2020) also shows that genes from the TATA‐enriched group show higher variability compared to the paused genes (Wilcoxon two‐sided test, *
P < 10
−15).
The frequency of cells with detectable expression (> one read) in the highest expressing tissue (different for each gene) was calculated for all genes in the different effector gene groups. The median frequency of expressing cells was higher for the highly paused genes compared with the TATA genes, stratified by the mean gene expression levels (left) and gene length (right). Across bins, the median frequency of cells with detectable expression was higher for the paused genes compared with the TATA genes.
The frequency of cells with detectable expression (> one read) in the five least expressing tissues (different for each gene) was calculated for all genes in the different effector gene groups, stratified by total expression in the expressing tissues for each gene (left) and by gene length (right). The median frequency of cells with detectable expression was higher across bins for the highly paused genes compared with the TATA genes.
Mean normalized RNA levels in the five least expressing tissues (different for each gene) were calculated for all genes in the different effector gene groups. The mean normalized RNA levels were higher for the highly paused genes compared with the TATA genes in the non‐expressing tissues (Wilcoxon two‐sided test, *P < 10−15).
Expression profiles of various genes from the TATA‐enriched and highly paused genes groups show that the TATA‐enriched group tends to have noisy expression without detectable background expression in non‐expressing tissues, while the highly paused genes tend to show very robust expression in the expressing tissues with high background expression in the non‐expressing tissues. Box plots in all panels show the median as the central line, the first and the third quartiles as the box, and the upper and lower whiskers extend from the quartile box to the largest/smallest value within 1.5 times of the interquartile range.

