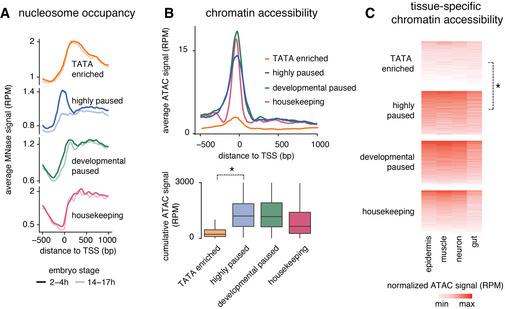
Figure EV3. Differences in accessibility at late‐induced effector gene groups.

- Average read‐count normalized MNase signal (RPM) from 2 to 4 h and 14 to 17 h embryos are shown at the different effector gene promoter groups and developmental and housekeeping genes.
- Chromatin accessibility is shown as the average read‐count normalized ATAC‐seq signal (RPM) from 14 to 17 h for each promoter group. TATA‐enriched genes show lower accessibility at the promoter region than the highly paused effector genes or developmental genes. Box plots below quantifying the reads from 150 bp upstream of the TSS to the TSS confirm the lower accessibility of TATA genes compared with the paused genes (Wilcoxon two‐sided test *P < 10−15). Box plots show the median as the central line, the first and the third quartiles as the box, and the upper and lower whiskers extend from the quartile box to the largest/smallest value within 1.5 times of the interquartile range.
- Read‐count normalized ATAC signals (RPM) from different tissues were calculated for each gene from 150 bp upstream of the TSS to the TSS. TATA‐enriched genes show lower average accessibility across all tissues compared with the highly paused effector genes or developmental genes (Wilcoxon two‐sided test, *P < 10−15).
