Fig. 3.
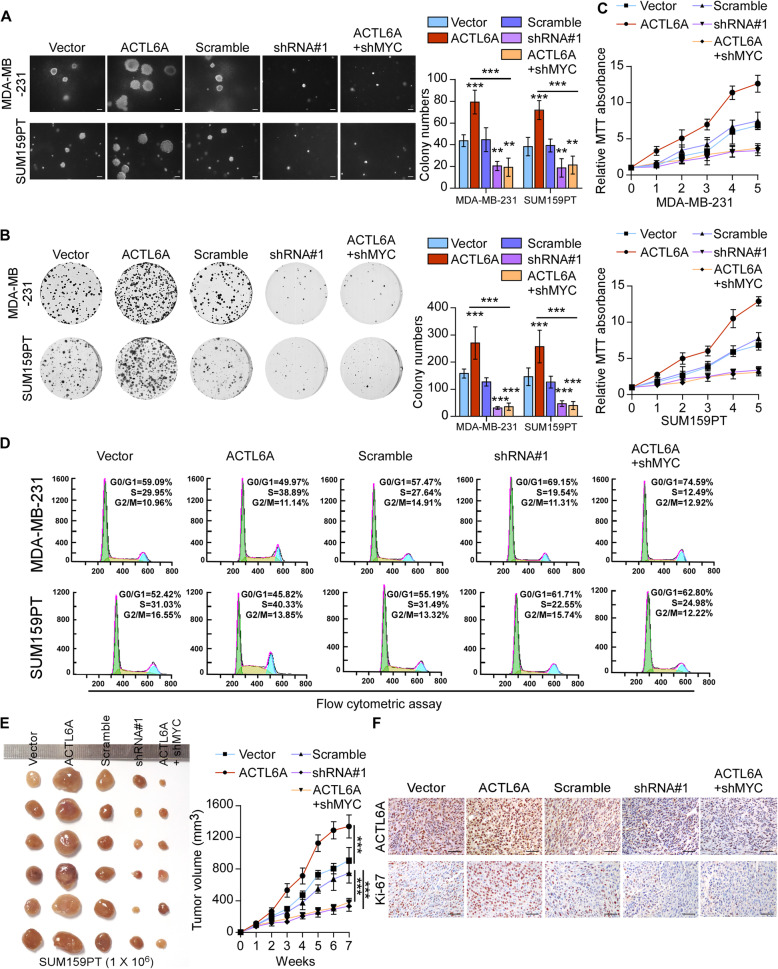
ACTL6A promotes cell proliferation and tumorigenicity via MYC signaling in TNBC cells. a Representative images (left) and quantification (right) of anchorage-independent growth colony formation for the indicated cell lines. Scale bars represent 200 μm. b Representative images (left) and quantification (right) of colony formation for the indicated cell lines. c MTT assays showed the cell proliferative capacity. d Flow cytometric analysis of TNBC cells with altered ACTL6A expression. e Vector/scramble, ACTL6A-overexpressed, ACTL6A-silenced or ACTL6A-shMYC SUM159PT cell lines were subcutaneously injected into mice (1 × 10⁶/injection, n = 6/group). The tumor volumes in each group are shown. f IHC of Ki-67 staining showed in the indicated xenografts. Scale bars represent 50 μm. Data represent the means ± S.D. of three independent experiments. Two-tailed Student’s t test was used. **P < 0.01, ***P < 0.001

