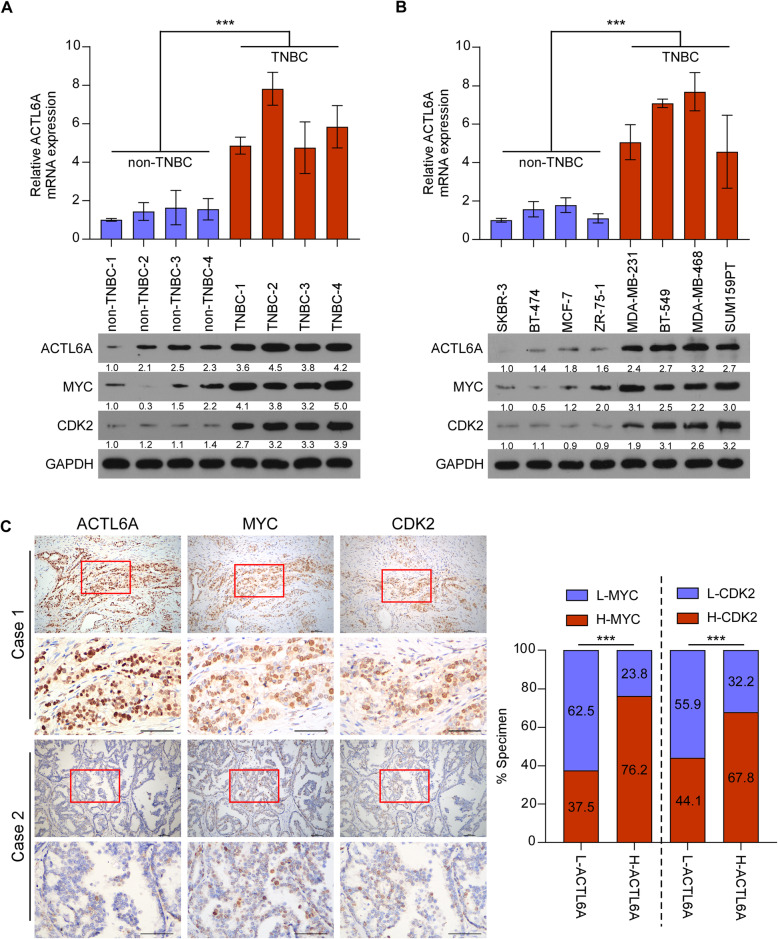
Fig. 5.
ACTL6A/MYC/CDK2 axis is upregulated in TNBC tissues and cell lines. a and b) Real-time PCR and western blotting analysis of ACTL6A, and western blotting analysis of MYC and CDK2 expression in human breast cancer tissues (a) and cell lines (b). GAPDH was used as a loading control. c Representative images of ACTL6A, MYC and CDK2 IHC staining in the same batch of breast cancer patient specimens. Scale bars represent 50 μm. Right panel, correlation analysis revealed that ACTL6A expression was significantly associated with MYC and CDK2 expression in patient specimens (χ2 test). ***P < 0.001

