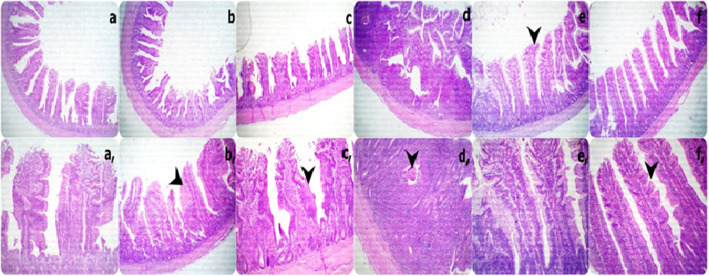
Fig. 3.
Representative photomicrograph of the low (40X) and high (100X) magnification H&E stained ileum segment sections showing short and thick villi with increase goblet cells metaplasia with hypertrophic enterocytes a, b and c groups: severe active associated lymphocytic aggregations (Pyre’s Patches) with necrotic parts (arrowhead) in d group: tall and thin villi with increase absorptive surfaces which represented by brad tips and serrated surfaces due to increase proliferated enterocytes (arrowhead) in both e and f groups. (a and a: 0Vit.C+ 0Saff. Oil group, b, and b: 0Vit.C + 5 Saff. Oil group, c, and c: 0Vit.C+ 10Saff. Oil group: d and d: 400Vit.C + 0Saff. Oil, e and e: 400Vit.C + 5Saff. Oil, f and f: 400Vit.C+ 10Saff. Oil group)

