Fig. 1.
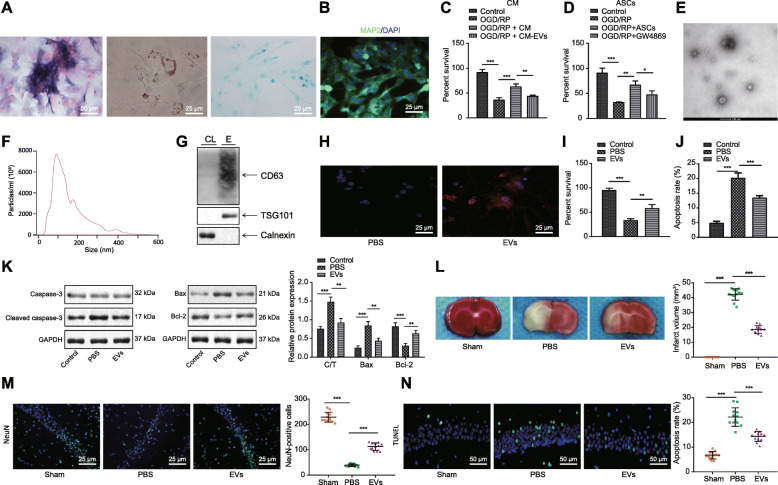
ASC-EVs protect neurons from ischemic injury. a Representative microscopic image of morphology of ASCs after osteogenesis, adipogenesis, and chondrogenesis. ALP for osteogenesis, Oil Red O staining for adipogenesis, and Alcian Blue staining for chondrogenesis (× 400). b Immunofluorescence of MAP2 expression in ASCs (× 400). c CCK-8 assay detection of cell viability of OGD/RP-induced neurons incubated in ASC-CM and EV-free CM, or controls. d CCK-8 assay detection of OGD/RP-induced neurons upon co-culture with ASCs and GW4869-treated ASCs, or controls. e Representative of EVs from ASCs under TEM (bar = 100 nm). f Quantification of size distribution of EVs under NTA. g Western blot analysis of specific EV-surface protein expression. h Representative images of neurons internalizing Dil-label EVs (red) and DAPI-labeled neuron nucleus (blue) (× 400). i CCK-8 assay detection of neuron viability upon treatment of ASC-EVs. j Flow cytometry detection of apoptosis upon ASC-EV treatment. k Western blot analysis of caspase 3, cleared caspase 3, Bax, and Bcl-2. C/T refers to the cleaved caspase 3/total caspase 3. l Representative macroscopic images of cerebral infraction volume with TCC staining. m NeuN immunofluorescence of hippocampus upon treatment of ASC-EVs, PBS, and sham operation (× 400). n Representative images of TUNEL staining of hippocampus apoptosis upon treatment of ASC-EVs, PBS, and sham operation (× 200). *p < 0.05, **p < 0.01, and ***p < 0.001. Measurement data were presented as mean ± standard deviation. The data among multiple groups were analyzed by ANOVA

