
Figure 6. Evaluation of toxicology and inflammation in mdx mice treated with long‐term repeated doses of PMO‐M or PMO.
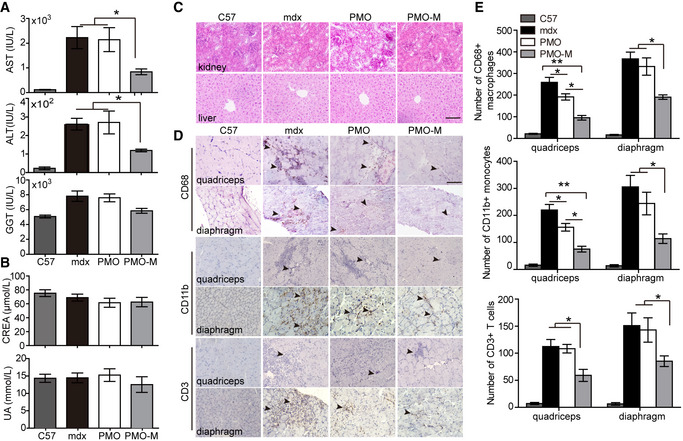
PMO‐M was administered intravenously into adult mdx mice at the PMO dose of 12.5 mg/kg/week for 3 weeks followed by 12.5 mg/kg/month for 3 months and tissues / blood were harvested 2 weeks after last injection.
-
A, BMeasurement of serum indices including liver enzymes (AST, ALT, and GGT) (A) and kidney markers (CREA and UA) (B) from wild‐type C57BL/6 (C57) (n = 3), untreated mdx controls (mdx) (n = 3), and mdx mice treated with PMO‐M (n = 4) or PMO alone (n = 3) to reflect liver and kidney functions (*P < 0.05, one‐way ANOVA post hoc Student–Newman–Keuls test).
-
CMorphological examination of liver and kidney from wild‐type C57BL/6 (C57), untreated mdx controls (mdx), and treated mdx mice (scale bar: 100 μm).
-
D, EImmunohistochemistry (D) and quantification (E) of macrophages, T cells, and monocytes in quadriceps and diaphragm from wild‐type C57BL/6 (C57) (n = 3), untreated mdx controls (mdx) (n = 3), and mdx mice treated with PMO‐M (n = 4) or PMO (n = 3) (scale bar: 100 μm). The arrowheads point to CD68+ macrophages, CD3+ T cells, or CD11b+ monocytes (*P < 0.05, **P < 0.001, one‐way ANOVA post hoc Student–Newman–Keuls test).
Data information: Data were presented as mean ± sem. Exact P values are specified in Appendix Table S1.