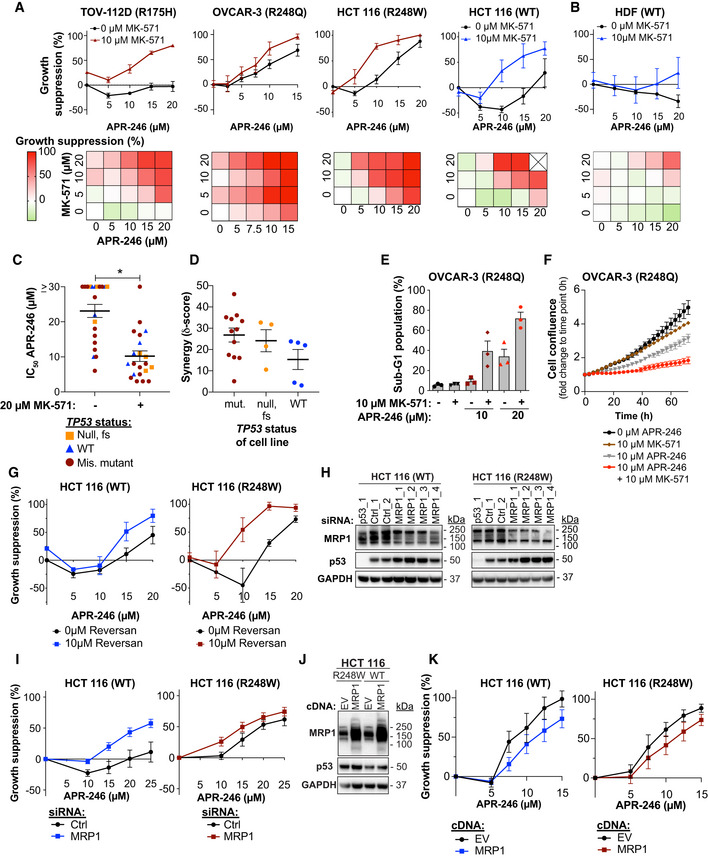
Figure 1. Inhibition of efflux pump MRP1 synergizes with APR‐246.

- Growth suppression in cancer cells after 72 h of treatment with APR‐246 +/− MRP1 inhibitor MK‐571 as shown by the WST‐1 assay (n ≥ 3, n shown in Appendix Table S1). Cross in heatmap indicates no data available.
- Growth suppression in human dermal fibroblasts (HDF) by WST‐1 assay after 72 h with APR‐246 +/− MK‐571 (n = 3).
- Mean IC50 values (µM) for APR‐246 +/− 20 μM MK‐571 of 21 cell lines. *P < 0.0001, Wilcoxon test. Each dot represents one cell line. Mean IC50 values and n shown in Appendix Table S1.
- ZIP synergy scores of most synergistic area sub‐grouped according to TP53 gene status for 21 cell lines. Each dot represents one cell line. Scores and n are shown in Appendix Table S1.
- Sub‐G1 DNA content of OVCAR‐3 cells (R248Q) after APR‐246 +/− MK‐571 treatment as assessed by propidium iodide staining at 48 h (n = 3).
- OVCAR‐3 cell confluency by IncuCyte® during 72 h of treatment with APR‐246 +/− MK‐571 (n = 3).
- Growth suppression in HCT116 WT (n = 4) and R248W cells (n = 3) after 72‐h treatment with APR‐246 +/− MRP1 inhibitor Reversan, as shown by WST‐1.
- Western blot analysis of MRP1 (Cell Signaling), p53 (DO‐1), and GAPDH of HCT116 WT and R248W cells 48 h after transfection with negative control siRNAs or siRNAs targeting MRP1 or p53.
- Growth suppression (WST‐1 assay) of HCT116 WT and R248W cells transfected with MRP1 siRNA (n ≥ 5 and n ≥ 2, respectively) after 48 h APR‐246 treatment. Indicated values are average of four individual siRNAs targeting MRP1 and two individual negative control siRNAs. Data and n of individual siRNAs are shown in Appendix Fig S1J; data are also part of Fig 7B.
- Western blot analysis of MRP1 (Cell Signaling), p53 (DO‐1), and GAPDH of HCT116 WT and R248W cells 72 h after transfection with empty vector (EV) and MRP1 expression vector.
- Growth suppression (WST‐1 assay) of HCT116 WT and R248W cells transfected with empty vector (EV) and MRP1 expression vector after 72 h APR‐246 treatment (n = 4). Data are also part of Appendix Fig S7E.
Data information: TP53 status is shown for each cell line. Data are represented as mean ± SEM. See also Fig EV1, Appendix Fig S1 and Appendix Table S1.
Source data are available online for this figure.
