
Figure 4. MRP1 inhibition increases GS‐MQ content, forming a reservoir of MQ for interaction with other targets.
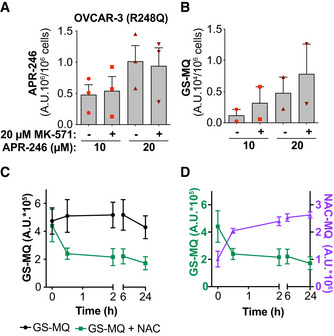
- APR‐246 content in OVCAR‐3 cells (TP53 R248Q) 24 h after treatment with APR‐246 +/− MK‐571 (n = 3).
- Glutathione‐conjugated MQ (GS‐MQ) in OVCAR‐3 cells after 24‐h treatment with APR‐246 +/− MK‐571 (n = 2).
- Amount of GS‐MQ at indicated timepoints after incubation of GS‐MQ +/− NAC (n = 2). See Fig EV4 for chemical reaction.
- Amount of GS‐MQ by LC‐MS (green line, left axis) and NAC‐MQ (purple line, right axis) over time after incubation of GS‐MQ with NAC (n = 2). Values on y‐axes are not comparable because GS‐MQ and NAC‐MQ have different response signals on MS.
Data information: Indicated values are assessed by LC‐MS. Data are represented as mean ± SEM. See also Appendix Fig S4.