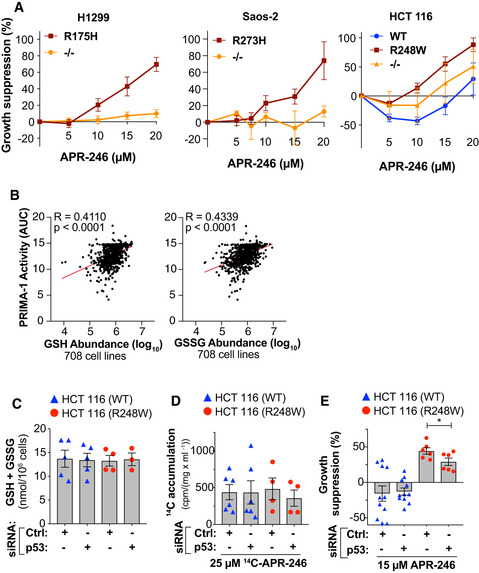
Figure EV5. APR‐246 sensitivity is dictated by the presence of mutant p53, cellular thiol status, and drug accumulation.

- Correlation of PRIMA‐1 AUC with GSH and GSSG abundance in 708 cell lines from the DepMap portal. R and P values were determined by Pearson’s correlation.
- Total GSH + GSSG by a GR re‐cycling assay in HCT116 WT and R248W cells 48 h after siRNA p53 transfection. Values are averages of 1‐2 different siRNAs against TP53 and 1‐2 different controls (WT n = 3 R248W n = 2), individual values are shown in Appendix Fig S7K.
- 14C‐accumulation (cpm/(mg/ml)) in HCT116 WT and R248W cells 24 h after treatment with 14C‐APR‐246 and 48 h after transfection of siRNAs against p53. Values are averages of 2 different siRNAs against p53 and 2 different controls (WT n = 3 R248W n = 2). Values of individual siRNAs are shown in Appendix Table S4.
- Growth suppression in HCT116 WT and R248W cells after 48 h of APR‐246 treatment and 96 h post‐transfection of +/− siRNAs targeting p53 as determined by the WST‐1 assay. Values are averages of 2 different siRNAs against TP53 and 2 different controls (WT n = 5–6 and R248W n = 3) *P = 0.047, Paired t‐test.
Data information: TP53 status is indicated for each cell line. Data are represented as mean ± SEM.
