
Figure 6. MRP1 inhibitor MK‐571 shifts cellular thiol pools, further potentiating APR‐246 efficacy.
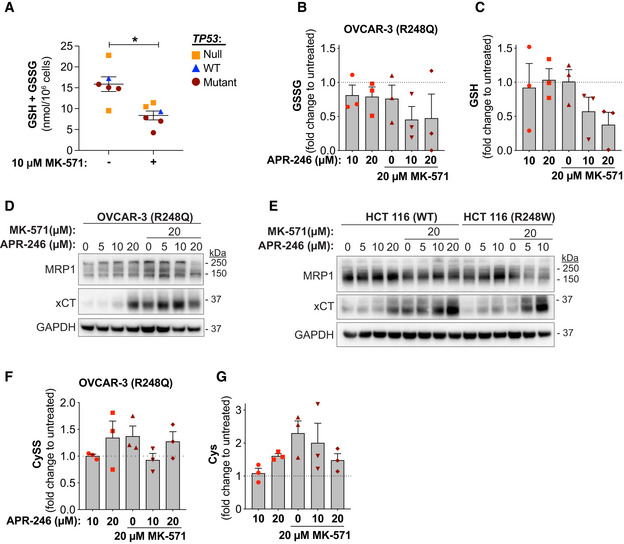
- Total intracellular glutathione (GSH + GSSG per 106 cells), as determined by GR re‐cycling assay after 24‐h MK‐571 treatment in six different cell lines (n ≥ 3, except HCT116 WT n = 2). *P = 0.014, Paired t‐test. Each dot represents one cell line, see Fig EV6 for individual cell lines and n.
- Intracellular oxidized glutathione (GSSG per 106 cells) as shown by LC‐MS in OVCAR‐3 (R248Q TP53) cells at 24‐h treatment with APR‐246 +/− MK‐571 (n = 3).
- Intracellular reduced glutathione (GSH per 106 cells) as shown by LC‐MS in OVCAR‐3 cells at 24‐h treatment with APR‐246 +/− MK‐571 (n = 3).
- Western blot analysis of MRP1 (Cell Signaling), xCT, and GAPDH of OVCAR‐3 cells treated with APR‐246 +/− MK‐571 for 24 h.
- Western blot analysis of MRP1 (Cell Signaling), xCT, and GAPDH of HCT116 WT and R248W cells treated with APR‐246 +/− MK‐571 for 24 h.
- Intracellular cystine (CySS per 106 cells) as shown by LC‐MS in OVCAR‐3 cells at 24 h treatment with APR‐246 +/− MK‐571 (n = 3).
- Intracellular cysteine (Cys per 106 cells) as shown by LC‐MS in OVCAR‐3 cells at 24 h treatment with APR‐246 +/− MK‐571 (n = 3).
Data information: TP53 status is indicated. Data are represented as mean ± SEM. See also Fig EV6 and Appendix Fig S6.
Source data are available online for this figure.