
Figure EV1. IHC of individual ALSP brain sections.
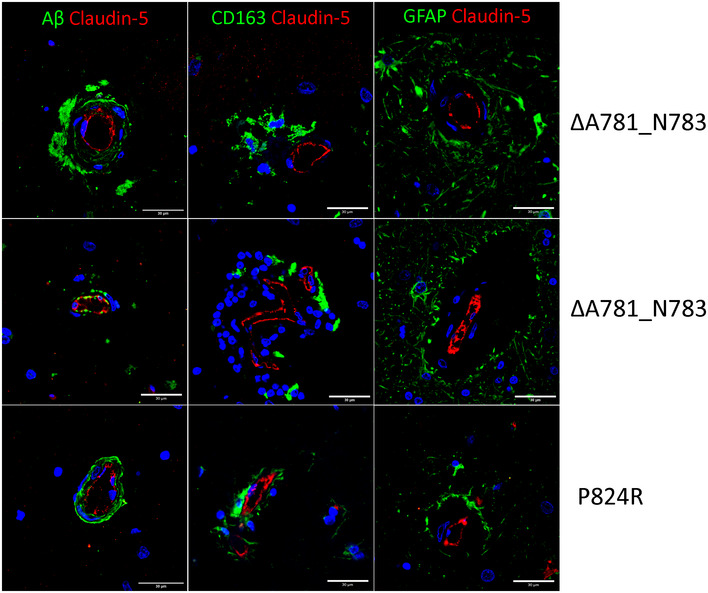
IHC of individual ALSP patient post‐mortem tissue for amyloid‐β (green) and CLD5 (red), GFAP (green) and CLD5 (red), CD163 (green) and CLD5 (red). Note that claudin‐5/GFAP images and claudin‐5/CD163 images are the same as those shown in Fig 6C and F and are shown here again for ease of comparison. Scale bars indicate 30 μm.