-
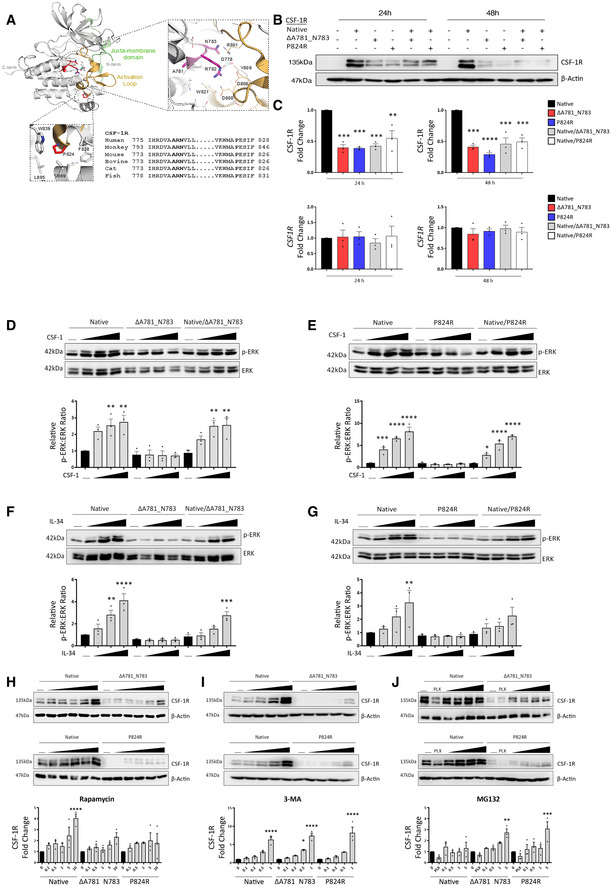
A
Structure‐sequence analysis and context of the CSF‐1R ΔA781_N783 and P824R variants. Sequences used in the alignment correspond to Uniprot sequences for CSF‐1R as follows: Human
P07333, Cynomolgus Monkey A0A2K5WG91, Mouse
P09581, Bovine A7Z067, Cat
P13369, Zebrafish
Q9I8N6.
-
B
Western blot for CSF‐1R and Actin in HEK293 cells transfected with native and variant CSF‐1R as indicated.
-
C
Densitometry (top) and qPCR analysis of native and variant CSF‐1R expression in HEK293 cells relative to native‐transfected at 24 and 48 h (****P < 0.0001, ***P < 0.0005, , **P < 0.005 one‐way ANOVA with Sidak's post‐test for multiple comparison, n = 3 biological replicates, error bars indicate SEM).
-
D–G
Western blot for phosphorylated and total ERK in HEK293 cells transfected with native and ΔA781_N783 (left) or P824R (right) CSF‐1R and treated with CSF‐1 (D, E) or IL‐34 (F, G) for 10 min. Horizontal line indicates untreated cells, with increasing concentrations 10, 50 and 100 ng/ml. Corresponding densitometry displays the ratio of phospho‐ERK to total ERK, normalised to the ratio of the untreated control for the native receptor (****P < 0.0001, ***P < 0.0005, **P < 0.01, *P < 0.05, one‐way ANOVA with Sidak’s post‐test for multiple comparison, n = 3 biological replicates, , error bars indicate SEM).
-
H
Western blot for CSF‐1R in HEK293 cells transfected with native and ΔA781_N783 (top) or P824R (bottom) CSF‐1R and treated with rapamycin. Horizontal line indicates untreated cells, with concentrations 0.1, 0.5, 1, 5, 10 μM. Corresponding densitometry (below) displays the fold change of CSF‐1R relative to the untreated control for each transfection (****P < 0.0001, one‐way ANOVA with Sidak's post‐test for multiple comparison to untreated, n = 3 biological replicates, error bars indicate SEM).
-
I
Western blot for CSF‐1R in HEK293 cells transfected with native and ΔA781_N783 (top) or P824R (bottom) CSF‐1R and treated with 3‐methyladenosine. Horizontal line indicates untreated cells, with increasing concentrations 0.1, 0.2, 0.5, 1 mM. Corresponding densitometry (below) displays the fold change of CSF‐1R relative to the untreated control for each transfection (****P < 0.0001, *P = 0.0114, one‐way ANOVA with Sidak's post‐test for multiple comparison to untreated, n = 3 biological replicates, error bars indicate SEM).
-
J
Western blot for CSF‐1R and Actin in HEK293 cells transfected with native and ΔA781_N783 (top) or P824R (bottom) CSF‐1R and treated with MG132 or PLX3397. Horizontal line indicates untreated cells, 20 μM PLX3397, with increasing concentrations 0.1, 0.5, 0.1, 5 μM. Corresponding densitometry (below) displays the fold change of CSF‐1R relative to the untreated control for each transfection (***P = 0.0002, **P = 0.002, one‐way ANOVA with Sidak's post‐test for multiple comparison to untreated, n = 3 biological replicates, error bars indicate SEM).

