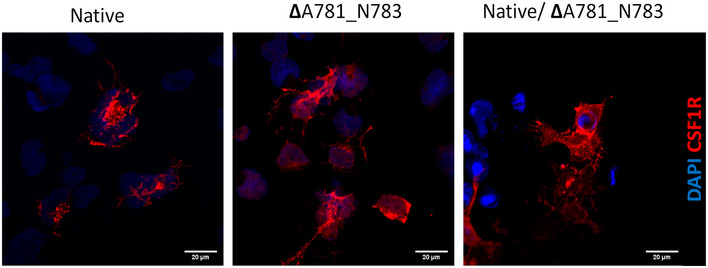
Figure EV2. Immunocytochemistry of CSF‐1R expressing HEK293 cells.

ICC for CSF‐1R (red) and DAPI (blue) showing membrane localisation of both native and variant CSF‐1R. Scale bars indicate 30 μm.

ICC for CSF‐1R (red) and DAPI (blue) showing membrane localisation of both native and variant CSF‐1R. Scale bars indicate 30 μm.