-
A, B
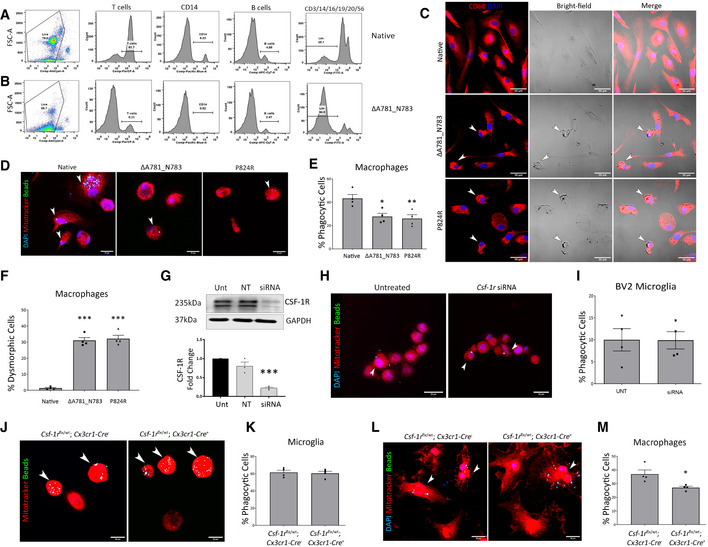
FACS of control and ΔA781_N783 PBMCs using lineage markers for CD3 (T cells), CD14 (monocytes/macrophages), CD19 (B cells), CD16, CD20 and CD56. Cells negative for all 6 makers were determined to be lineage‐negative (Lin−).
-
C
Immunocytochemistry of macrophages differentiated in vitro from control, ΔA781_N783 or P824R PBMCs. Cells were stained for DAPI (blue) and CD68 (red). White arrows indicate dysmorphic macrophages.
-
D
Immunocytochemistry of macrophages differentiated in vitro from control, ΔA781_N783 or P824R PBMCs. Macrophages were stimulated with LPS and exposed to fluorescent opsonised latex beads for 1 h before fixation and quantification of bead+ cells via microscopy. Cells were stained using MitoTracker (red) and DAPI (blue).
-
E
Quantification of phagocytic activity expressed as percentage bead+ cells. P values were calculated using (**P = 0.008, *P = 0.0141, one‐way ANOVA with Tukey’s multiple comparison test, n = 4 assays, error bars indicate SEM).
-
F
Quantification of macrophages displaying an aberrant morphology as indicated in (c), displayed as percentage of dysmorphic cells per image (***P < 0.0005, one‐way ANOVA with Dunnett’s multiple comparison test, data representative of n = 2 independent differentiations, with two fields of view imaged per well, error bars indicate SEM).
-
G
Western blot for CSF‐1R in untreated (Unt) BV2 microglia, or BV2 microglia transfected with non‐targeting or Csf‐1r targeting siRNA. Corresponding densitometry (below) representative of technical replicate of n = 3 blots (one‐way ANOVA with Dunnett’s multiple comparison, ***P = 0.0003, error bars indicate SEM).
-
H
Immunocytochemistry of untreated and Csf‐1r siRNA treated BV2 microglia. BV2 microglia were stimulated with LPS and exposed to fluorescent opsonised latex beads for 1 h before fixation and quantification of bead+ cells via microscopy. Cells were stained using MitoTracker (red) and DAPI (blue). Arrowheads (white) indicate bead+ cells.
-
I
Quantification of BV2 phagocytic activity expressed as percentage bead+ cells (data representative of n = 2 independent differentiations, with two fields of view imaged per well, error bars indicate SEM).
-
J
Immunocytochemistry of microglia isolated from Csf‐1rflx
/
wt;Cx3cr1‐Cre
− and Csf‐1rflx
/
wt;Cx3cr1‐Cre
+ P0 mouse pup brains. Microglia were stimulated with LPS and exposed to fluorescent opsonised latex beads for 1 h before fixation and quantification of bead+ cells via microscopy. Cells were stained using MitoTracker(red). Arrowheads (white) indicate bead+ cells.
-
K
Quantification of mouse microglial phagocytic activity expressed as percentage bead+ cells (n = 4 assays, error bars indicate SEM).
-
L
Immunocytochemistry of macrophages differentiated in vitro from Csf‐1rflx
/
wt;Cx3cr1‐Cre
− and Csf‐1rflx
/
wt;Cx3cr1‐Cre
+ mouse bone marrow. Macrophages were stimulated with LPS and exposed to fluorescent opsonised latex beads for 1 h before fixation and quantification of bead + cells via microscopy. Cells were stained using MitoTracker (red) and DAPI (blue). Arrowheads (white) indicate bead+ cells.
-
M
Quantification of mouse macrophage phagocytic activity expressed as percentage bead+ cells. (*P = 0.024, Student’s t‐test with Welch’s correction, n = 4 assays, error bars indicate SEM).

