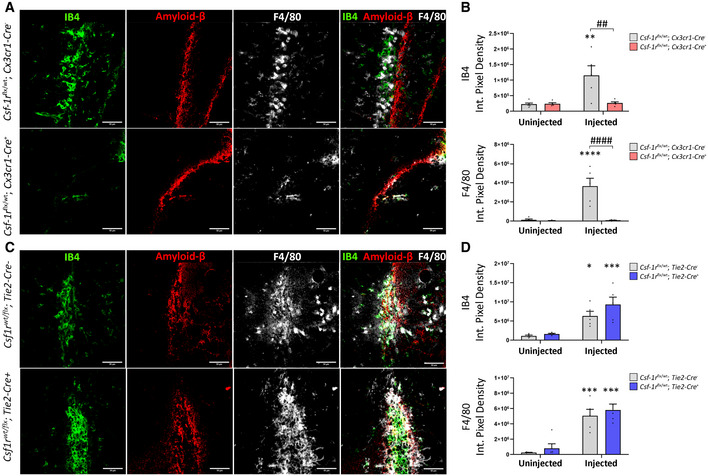
Figure 4. CSF‐1R expression in endothelial cells and macrophages affects response to amyloid injection.

- Immunohistochemistry of Csf‐1rflx / wt;Cx3cr1‐Cre − (top) and Csf‐1rflx / wt;Cx3cr1‐Cre + (bottom) mice unilaterally injected with Aβ1‐42 in the hippocampus and stained for IB4 (green), F4/80 (white) and Aβ (red). Scale bars indicate 50 μm.
- Quantification of F4/80 and IB4 immunopositivity following intrahippocampal injection of Aβ1‐42. Quantification of immunopositivity in both injected and uninjected hippocampi of Csf‐1rflx / wt;Cx3cr1‐Cre − and Csf‐1rflx / wt;Cx3cr1‐Cre + mice. (Two‐way ANOVA with Sidak’s test for multiple comparisons. Asterisks (*) indicate comparison to immunopositivity values of the uninjected hippocampus, obliques (#) indicate comparison between Csf‐1rflx / wt;Cx3cr1‐Cre − and Csf‐1rflx / wt;Cx3cr1‐Cre + mice, ## or **P < 0.003, #### or ****P < 0.0001, n = 5 mice per group, error bars indicate SEM.)
- Immunohistochemistry of Csf‐1rflx / wt; Tie2‐Cre − (top) and Csf‐1rflx / wt;Tie2‐Cre + mice (bottom) mice unilaterally injected with Aβ1‐42 in the hippocampus and stained for IB4 (green), F4/80 (white) and Aβ (red).
- Quantification of F4/80 and IB4 immunopositivity following intrahippocampal injection of Aβ1‐42. Quantification of immunopositivity in both injected and uninjected hippocampi of Csf‐1rflx / wt;Tie2‐Cre − and Csf‐1rflx / wt;Tie2‐Cre + mice. (n = 5 mice per group. Two‐way ANOVA with Sidak’s test for multiple comparisons. Asterisks (*) indicate comparison to immunopositivity values of the uninjected hippocampus, *P < 0.01, ***P < 0.0005, error bars indicate SEM).
