-
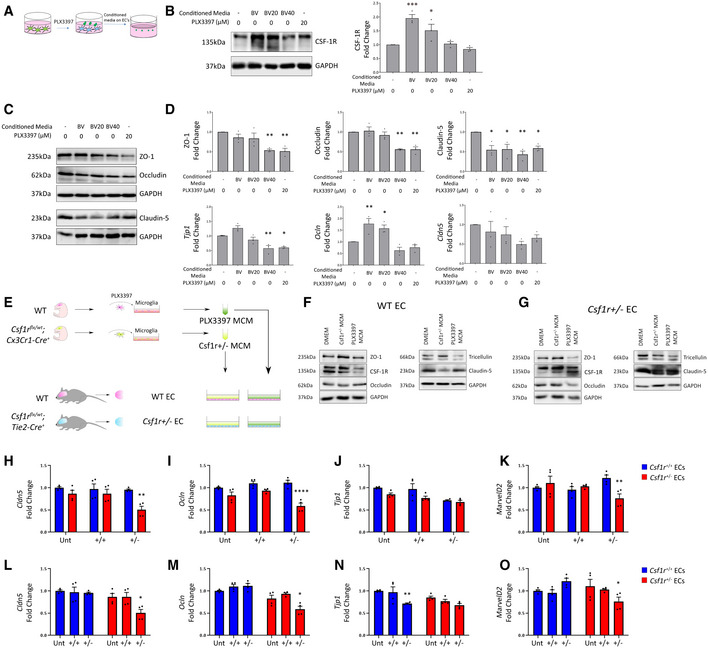
A
Schematic for experimental design.
-
B
Western blot for CSF‐1R in b.End3 cells treated with different BV2 conditioned media or PLX3397, with corresponding densitometry (right). (n = 3 independent BV2 media conditionings and b.End3 treatments, one‐way ANOVA with Dunnett’s post‐test for multiple comparisons, *P < 0.05, ***P < 0.0005, error bars indicate SEM).
-
C
Western blot for tight junction proteins in b.End3 cells treated with unconditioned, microglia conditioned media or PLX3397.
-
D
Densitometry of tight junction protein changes (top) and transcriptional changes in Tjp1, Ocln and Cld5 (bottom) following conditioned media treatments or 20 μM PLX3397. (n = 3 independent BV2 media conditionings and b.End3 treatments, one‐way ANOVA with Dunnett’s post‐test for multiple comparisons, *P < 0.05, **P < 0.009, error bars indicate SEM).
-
E
Schematic for experimental design.
-
F
Western blot of WT endothelial cells treated with unconditioned or microglia conditioned media (MCM) produced from Csf‐1r
+/− or PLX3397‐inhibited microglia.
-
G
Western blot of Csf‐1r
+/− endothelial cells treated with unconditioned, Csf‐1r
+/− MCM or PLX3397 MCM.
-
H–K
qPCR of wild type (blue) or Csf‐1r
+/− (red) endothelial cells treated with control, Csf‐1r
+/+ MCM or Csf‐1r
+/− MCM. Statistical analyses of inter‐genotype changes. (****P < 0.0001, **P < 0.005, Scatter plots represent technical replicates of n = 2 independent primary cell isolations and microglia conditionings, Two‐way ANOVA with multiple comparisons and Sidak’s post‐test, error bars indicate SEM).
-
L–O
qPCR of wild type (blue) or Csf‐1r
+/− (red) endothelial cells treated with control, Csf‐1r
+/+ MCM or Csf‐1r
+/− MCM. Statistical analyses of changes relative to respective untreated Control. (**P < 0.005, *P < 0.05. Scatter plots represent technical replicates of n = 2 independent primary cell isolations and microglia conditionings, two‐way ANOVA with multiple comparisons and Sidak’s post‐test, error bars indicate SEM).

