-
A, B
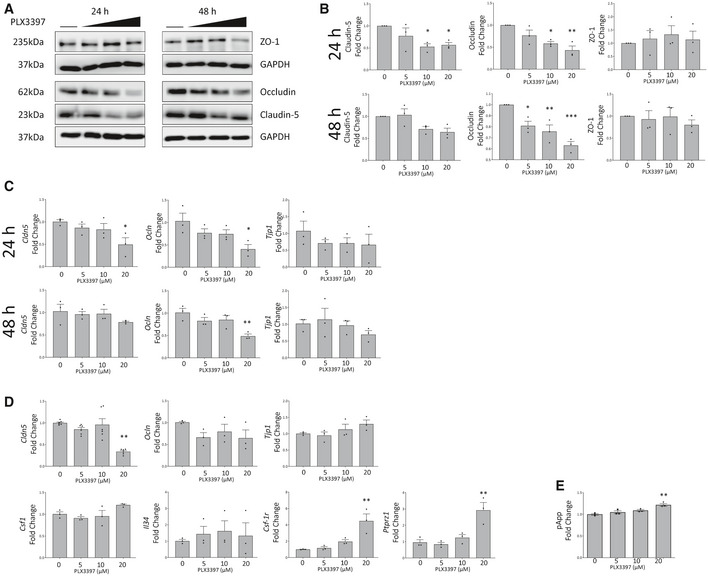
Western blot of lysates from PLX3397 treated b.End3 cells for tight junction proteins ZO‐1, Occludin and Claudin‐5 (A). The horizontal line indicates untreated cells, with increasing PLX3397 concentrations (5, 10, 20 μM). Corresponding densitometry is given in (B). (One‐way ANOVA with Dunnett’s post‐test for multiple comparisons, *P < 0.05, **P < 0.005, ***P < 0.0005, n = 3 independent experiments, error bars indicate SEM)
-
C
Gene expression changes at 24 (top) and 48 (bottom) h in PLX3397 treated b.End3 cells shown by qPCR for Tjp1, Ocln and Cldn5 (*P < 0.05, **P < 0.006, n = 3 independent experiments one‐way ANOVA with Dunnett’s post‐test, error bars indicate SEM).
-
D
qPCR analysis of tight junction and CSF‐1R pathway gene expression changes at 24 h in PLX3397 treated MBECs (one‐way ANOVA with Dunnett’s post‐test for multiple comparisons, **P < 0.009, n = 3 independent experiments, error bars indicate SEM).
-
E
FITC‐4kDA transwell permeability assay of primary mouse microvascular endothelial cells (MBECs) treated for 24 h with PLX3397 at indicated doses (one‐way ANOVA with Dunnett’s correction, n = 3 technical replicates for flux assay, one‐way ANOVA with Dunnett’s post‐test for multiple comparisons, **P = 0.0012, error bars indicate SEM).

