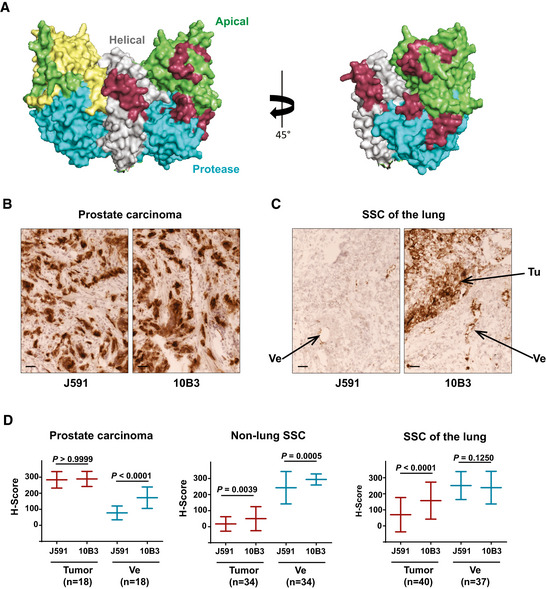
Figure 1. Binding regions of the PSMA antibodies 10B3 and J591 and comparative reactivity with prostate carcinoma and lung SCC samples.

-
ABinding regions of the 10B3 antibody as determined by conjugation mass spectrometry (in dark red) and of J591 (in yellow) (Bander et al, 2003a) are labeled in a 3D model of the PSMA molecule as reported by Davis et al (2005) in a dimeric (left panel) or monomeric (right panel) representation of the molecule (PDB ID code 1Z8L). Apical, helical, and protease domains are colored in green, gray, and blue, respectively.
-
B, CCryosections of samples from patients with prostate carcinoma and SCC of the lung. Samples were processed as described in the Materials and Methods section. Ve = vessel, Tu = tumor. Scale 50µm. See also (D) for comparative semi‐quantitative analysis of a panel of samples from patients with prostate carcinoma, lung SCC and non‐lung SCC.
-
DSemi‐quantitative analysis of binding of the PSMA antibodies 10B3 and J591 to cryosections from different tumor entities. For definition of the H‐score reflecting binding intensity, refer to the Materials and Methods section. Statistical analysis was performed using the paired, non‐parametric Wilcoxon test. Sample size (n) and the corresponding P‐values are indicated in the graphs.
