-
A
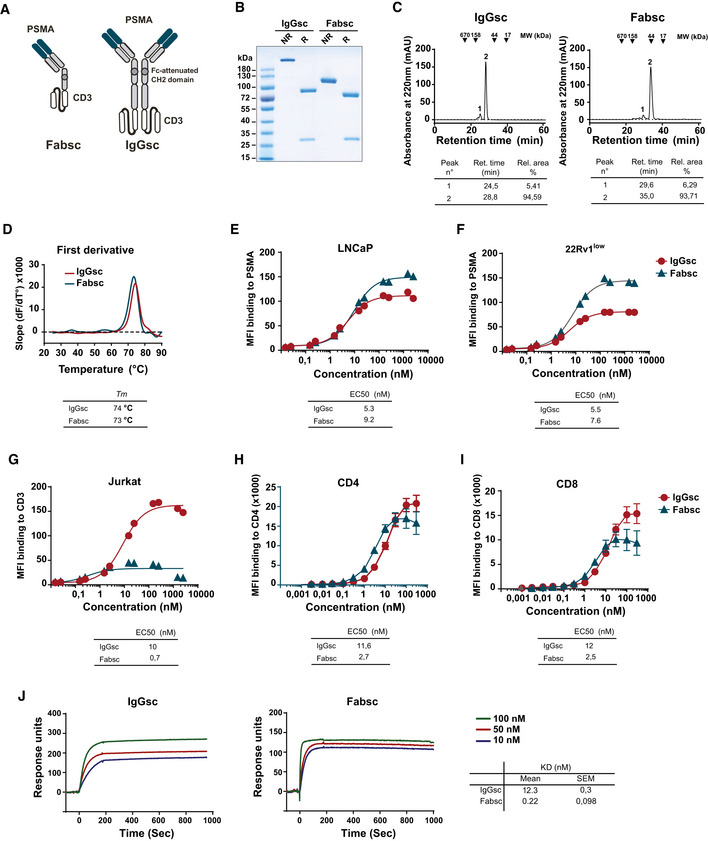
Schematic representation of the Fabsc and IgGsc format.
-
B
SDS–PAGE of IgGsc and Fabsc molecules. NR: non‐reduced; R: reduced.
-
C
Fabsc and IgGsc proteins were subjected to analytical chromatography using Superdex S200 Increase 10/300GL column. Representative gel filtration profiles and the corresponding analysis are presented in the tables below.
-
D
A fluorescence‐based thermal shift assay was performed as described the Materials and Methods section. The data were analyzed using the first derivative approach, and the calculated melting temperatures (T
m) are presented in the table below the profiles.
-
E, F
Binding of the Fabsc and IgGsc molecules to PSMA‐expressing LNCaP (E) or 22Rv1low (F) cells was assessed by flow cytometry, as described in the Materials and Methods section. The EC50 values were calculated using GraphPad Prism software and are presented below the figure.
-
G–I
Binding of the Fabsc and IgGsc molecules to CD3‐expressing Jurkat cells (G) and to CD4 T cells (H) and CD8 T cells (I) in PBMC preparations was assessed by flow cytometry. The results represent the average of three independent experiments performed with different PBMC donors. EC50 values are presented in the table below the figure.
-
J
Binding of the Fabsc and IgGsc molecules to a His‐tagged CD3 epsilon‐delta heterodimer was determined by SPR. CD3 heterodimer protein was immobilized to an NTA sensor chip and the binding kinetics of the IgGsc or Fabsc molecules was assessed at 25°C. The data obtained were analyzed using Biaevaluation software and the corresponding calculated KD values are presented in the table in the lower right.

