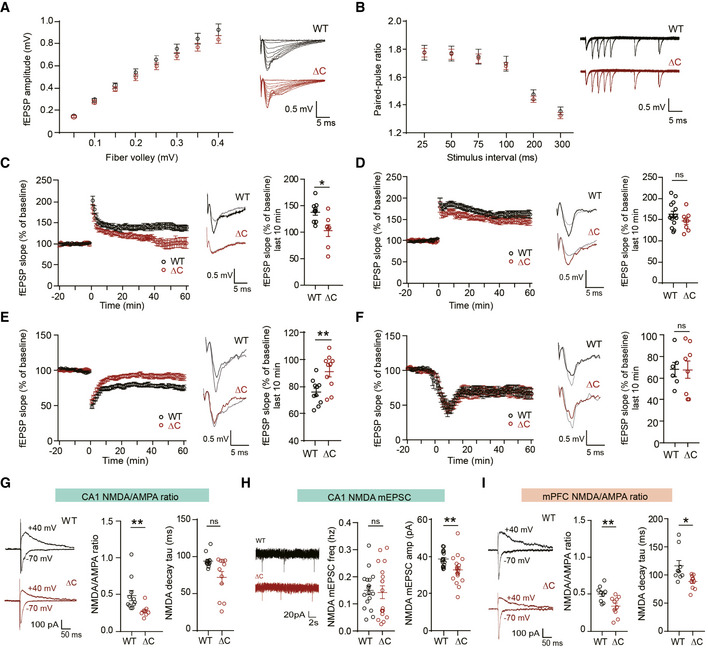
Figure 1. Suppressed NMDAR‐mediated synaptic transmission and plasticity in the PtenΔC / ΔC hippocampus.

-
ANormal basal excitatory synaptic transmission at SC‐CA1 synapses of PtenΔC / ΔC mice (4–5 weeks), indicated by the input–output curve of the amplitudes of field excitatory postsynaptic potentials (fEPSPs) plotted against stimulus intensities. (n = 10 slices from four mice for WT and nine (4) for ΔC, genotype P = 0.8378, two‐way repeated measures ANOVA with Bonferroni's multiple comparison test). The error bars represent Standard error of the mean SEM (see Appendix Table S1 “Statistics” for full details.
-
BNormal paired‐pulse facilitation at SC‐CA1 synapses of PtenΔC / ΔC mice (4–5 weeks), indicated by fEPSP slope ratios plotted against inter‐stimulus intervals. (n = 11 slices from four mice for WT and 11 (4) for ΔC, genotype P = 0.7376, two‐way repeated measures ANOVA with Bonferroni's test). The error bars represent SEM.
-
C, DSuppressed HFS‐LTP and normal TBS‐LTP at SC‐CA1 synapses of PtenΔC / ΔC mice (4–6 weeks). The gray traces represent baseline fEPSP prior to LTP induction. The error bars represent SEM. (n = 9 slices from six mice for WT and seven (6) for ΔC for HFS‐LTP, and 14 (9) for WT and eight (5) for ΔC for TBS‐LTP, *P < 0.05, ns, not significant, Mann–Whitney U‐test and Student's t‐test).
-
ESuppressed LFS‐LTD at SC‐CA1 synapses of PtenΔC / ΔC mice (P17–21). (n = 10 slices from six mice for WT and ΔC, **P < 0.01, Student's t‐test). The gray traces represent baseline fEPSP prior to LTD induction. The error bars represent SEM.
-
FNormal mGluR‐LTD at SC‐CA1 synapses of PtenΔC / ΔC mice (P17–21). (n = 6 slices from five mice for WT and eight (5) for ΔC, ns, not significant, Mann–Whitney U‐test). The gray traces represent baseline fEPSP prior to LTD induction. The error bars represent SEM.
-
GReduced NMDA/AMPA ratio at SC‐CA1 synapses of PtenΔC / ΔC mice (P17–21). The NMDAR component was obtained 60 ms after stimulation. (ratio, n = 11 cells from eight mice for WT and eight (8) for ΔC; decay, n = 12 cells from eight mice for WT and 11 (8) for ΔC, **P < 0.01, ns, not significant, Mann–Whitney U‐test). The error bars represent SEM.
-
HReduced amplitude but not frequency of NMDA‐mEPSCs at PtenΔC / ΔC CA1 pyramidal neurons. (n = 17 cells from four mice for WT and 18 (4) for ΔC, **P < 0.01, ns, not significant, Mann–Whitney U‐test, Student's t‐test). The error bars represent SEM.
-
IReduced NMDA/AMPA ratio at synapses in layer II/III pyramidal neurons in the prelimbic region of the mPFC of PtenΔC / ΔC mice (P20–21). The NMDAR component was obtained 60 ms after stimulation. (n = 9 cells from three mice for WT and 10 (3) for ΔC, *P < 0.05, **P < 0.01, Student's t‐test, Mann–Whitney U‐test). The error bars represent SEM.
Data information: (C–F) Results from the last 10‐min recordings are shown in scatter plots.
