
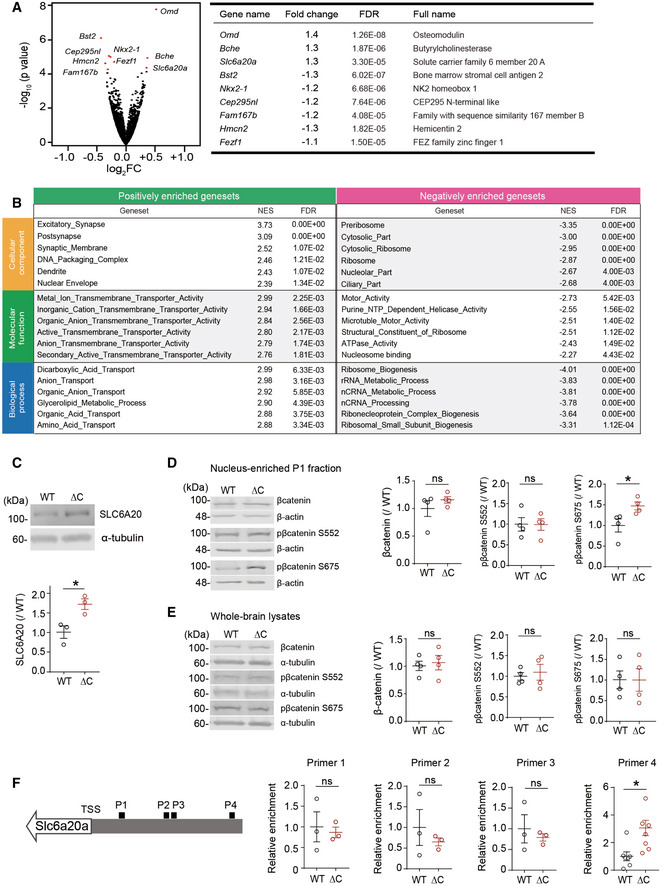
Figure 2. Increased expression of the Slc6a20a glycine transporter gene and decreased brain glycine levels in the PtenΔC / ΔC mice.
-
AA volcano plot showing DEGs (adjusted P value < 0.1) derived from RNA‐Seq results for PtenΔC / ΔC and WT mice (P21). For the calculation of adjusted P value, we have employed the R package DESeq2 where the P‐values obtained by the Wald test are corrected for multiple testing using the Benjamini and Hochberg method. (n = 3 mice for WT and ΔC). See also Dataset EV1 for the full RNA‐Seq results.
-
BGSEA analysis of RNA‐Seq results from PtenΔC / ΔC and WT mice (P21). Transcripts ranked by levels of expression (ΔC/WT ratio) were tested for enrichment in precurated gene sets in the C5 (gene ontology) category. NES, normalized enrichment score; positive and negative enrichments indicate a greater contribution of up‐ and downregulated genes, respectively, to the enrichments (see also Dataset EV2 for the full GSEA results).
-
CImmunoblot validation of the increase in SLC6A20 protein levels in hippocampal lysates of PtenΔC / ΔC mice (P21). We denoted the antibody as “SLC6A20” here, not “SLC6A20A”, because this antibody was generated using a synthetic peptide sequence (YNEPSNNCQKHAI) that is commonly present in SLC6A20A and SLC6A20B, being a pan‐SLC6A20 antibody (Thermo Fisher). (n = 3 mice for WT and ΔC, *P < 0.05, Student's t‐test). The error bars represent SEM.
-
D, EIncreased phosphorylation of β‐catenin at Ser‐675 but not at Ser‐552 in the nucleus‐enriched P1 fraction but not in whole‐brain lysates of PtenΔC / ΔC mice (3 months). Note that total levels of β‐catenin were not changed in the P1 fraction or whole‐brain lysates. (n = 4 mice for WT‐WB/P1 and ΔC‐WB/P1, *P < 0.05, ns, not significant, Student's t‐test). The error bars represent SEM.
-
FIncreased binding of β‐catenin in the promoter region of the Slc6a20a gene in PtenΔC / ΔC mice (P21), revealed by chromatin immunoprecipitation (ChIP) assay. Note that β‐catenin binding was increased selectively in the target region for the primer set #4 indicated in the diagram. TSS, transcriptional start site; P1–4; promoter regions targeted by the four primer sets. (n = 7 mice for WT‐P4 and ΔC‐P4 and 3 mice for WT‐P1/2/3 and ΔC‐P1/2/3, *P < 0.05, ns, not significant, Student's t‐test). The error bars represent SEM.
Source data are available online for this figure.